| Red | Green | Blue | |
| z | 17.64 | ||
| znorm | Inf | ||
| sky | -Inf | -Inf | -Inf |
| S/N | 26.5 | 44.7 | 47.2 |
| S/N(c) | 0.0 | 0.0 | 0.0 |
| SN(E/C) |
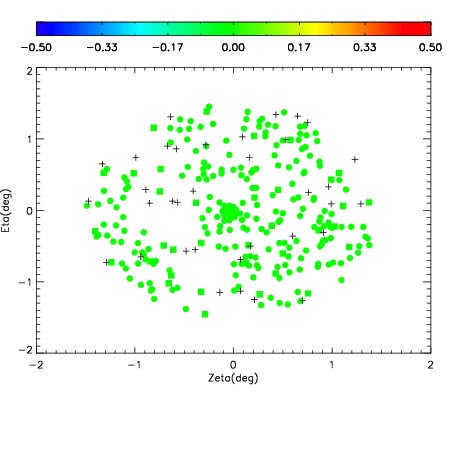
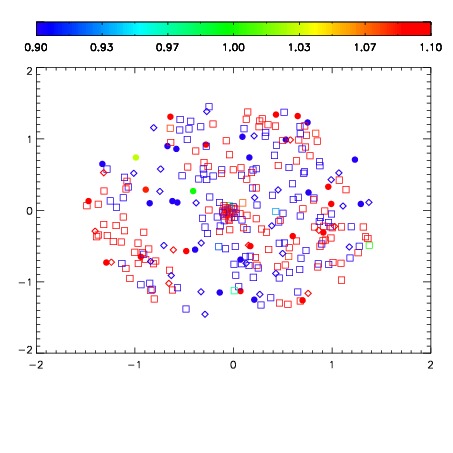


| Frame | Nreads | Zeropoints | Mag plots | Spatial mag deviation | Spatial sky 16325A emission deviations (filled: sky, open: star) | Spatial sky continuum emission | Spatial sky telluric CO2 absorption deviations (filled: H < 10) | |||||||||||||||||||||||
| 0 | 0 |
|
|
|
|
|
|
| IPAIR | NAME | SHIFT | NEWSHIFT | S/N | NAME | SHIFT | NEWSHIFT | S/N |
| 0 | 03050011 | 0.501794 | 0.00000 | 18.9697 | 03050012 | 0.00175371 | 0.500040 | 18.9713 |
| 1 | 03050015 | 0.501638 | 0.000155985 | 19.1693 | 03050016 | 0.000717198 | 0.501077 | 19.1807 |
| 2 | 03050014 | 0.501145 | 0.000648975 | 19.1377 | 03050013 | 0.000706774 | 0.501087 | 19.0576 |
| 3 | 03050010 | 0.501711 | 8.29697e-05 | 18.9482 | 03050009 | 0.00000 | 0.501794 | 18.9220 |