| Red | Green | Blue | |
| z | 17.64 | ||
| znorm | Inf | ||
| sky | -NaN | -NaN | -Inf |
| S/N | 26.6 | 46.4 | 48.1 |
| S/N(c) | 0.0 | 0.0 | 0.0 |
| SN(E/C) |
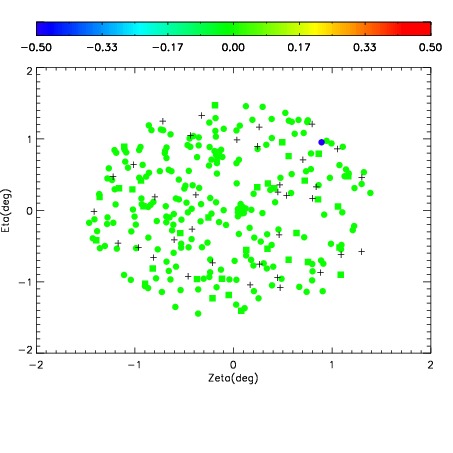
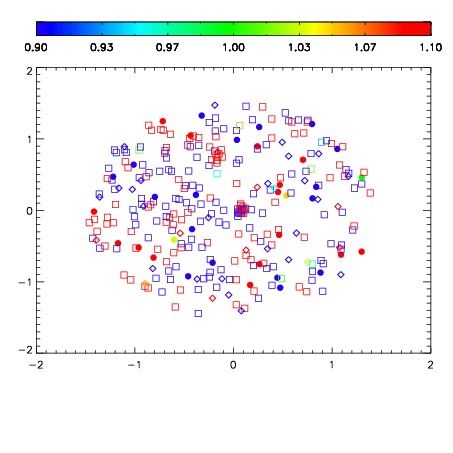
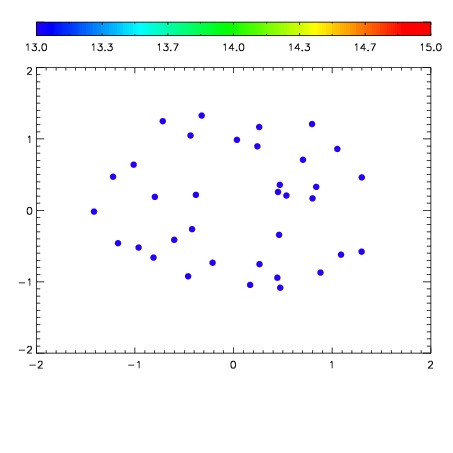

| Frame | Nreads | Zeropoints | Mag plots | Spatial mag deviation | Spatial sky 16325A emission deviations (filled: sky, open: star) | Spatial sky continuum emission | Spatial sky telluric CO2 absorption deviations (filled: H < 10) | |||||||||||||||||||||||
| 0 | 0 |
|
|
|
|
|
|
| IPAIR | NAME | SHIFT | NEWSHIFT | S/N | NAME | SHIFT | NEWSHIFT | S/N |
| 0 | 05470052 | 0.493651 | 0.00000 | 19.0280 | 05470051 | 0.00337136 | 0.490280 | 19.0015 |
| 1 | 05470053 | 0.493294 | 0.000357002 | 19.0532 | 05470054 | 0.00315662 | 0.490494 | 19.0913 |
| 2 | 05470048 | 0.493200 | 0.000450999 | 19.0391 | 05470047 | 0.00000 | 0.493651 | 19.0179 |
| 3 | 05470049 | 0.492670 | 0.000981003 | 19.0363 | 05470050 | 0.00338124 | 0.490270 | 19.0170 |