| Red | Green | Blue | |
| z | 17.64 | ||
| znorm | Inf | ||
| sky | -Inf | -NaN | -Inf |
| S/N | 30.0 | 51.0 | 53.9 |
| S/N(c) | 0.0 | 0.0 | 0.0 |
| SN(E/C) |
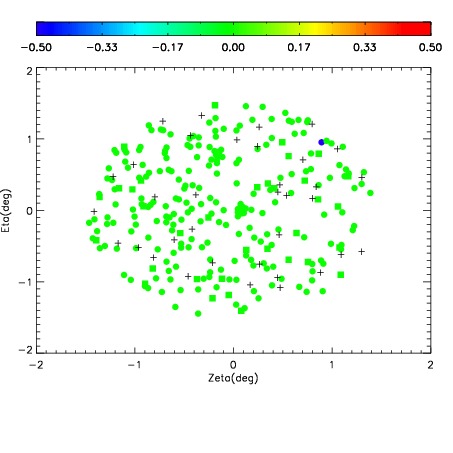
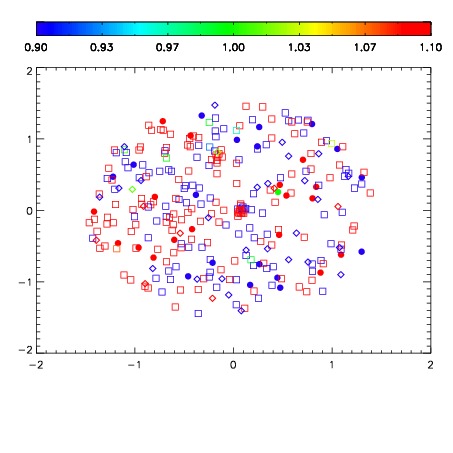
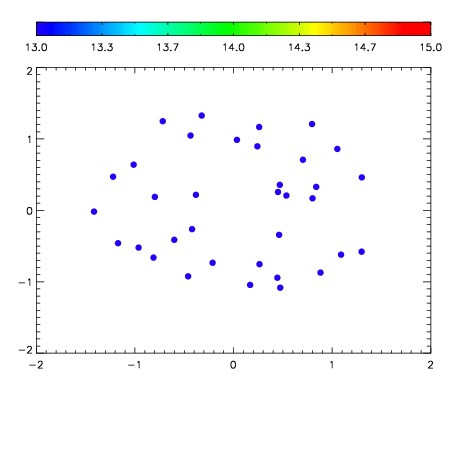

| Frame | Nreads | Zeropoints | Mag plots | Spatial mag deviation | Spatial sky 16325A emission deviations (filled: sky, open: star) | Spatial sky continuum emission | Spatial sky telluric CO2 absorption deviations (filled: H < 10) | |||||||||||||||||||||||
| 0 | 0 |
|
|
|
|
|
|
| IPAIR | NAME | SHIFT | NEWSHIFT | S/N | NAME | SHIFT | NEWSHIFT | S/N |
| 0 | 06020032 | 0.487876 | 0.00000 | 18.9858 | 06020026 | 0.00000 | 0.487876 | 19.0788 |
| 1 | 06020035 | 0.486411 | 0.00146499 | 19.0836 | 06020033 | 0.000473455 | 0.487403 | 19.1189 |
| 2 | 06020027 | 0.485844 | 0.00203201 | 19.0700 | 06020030 | -0.000317637 | 0.488194 | 19.1120 |
| 3 | 06020031 | 0.487342 | 0.000533998 | 18.9896 | 06020034 | -0.00126953 | 0.489146 | 19.0830 |
| 4 | 06020028 | 0.486679 | 0.00119701 | 18.9692 | 06020029 | 0.00158679 | 0.486289 | 19.0748 |