| Red | Green | Blue | |
| z | 17.64 | ||
| znorm | Inf | ||
| sky | -NaN | -NaN | -NaN |
| S/N | 21.8 | 39.9 | 40.7 |
| S/N(c) | 0.0 | 0.0 | 0.0 |
| SN(E/C) |
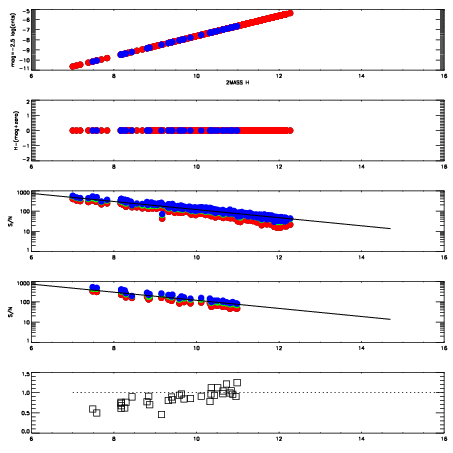
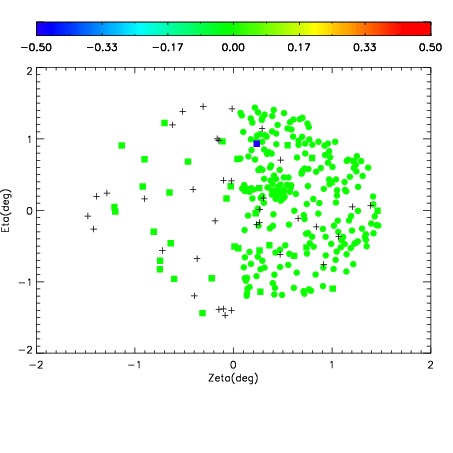
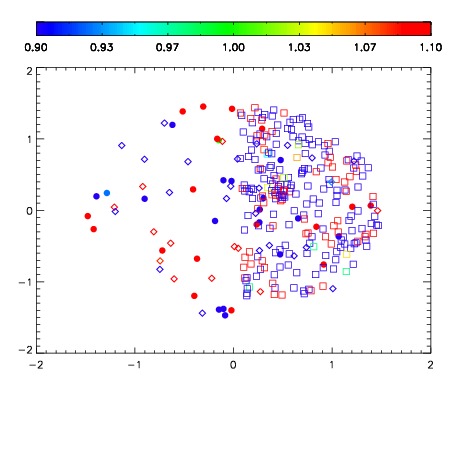
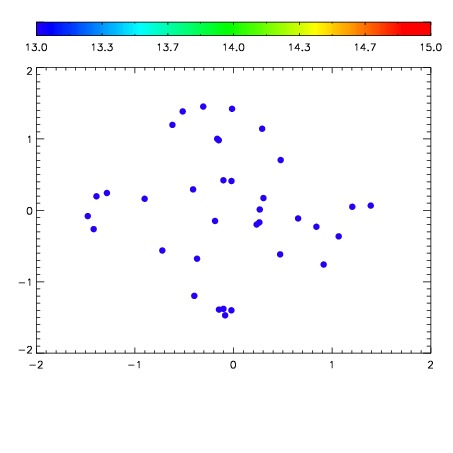

| Frame | Nreads | Zeropoints | Mag plots | Spatial mag deviation | Spatial sky 16325A emission deviations (filled: sky, open: star) | Spatial sky continuum emission | Spatial sky telluric CO2 absorption deviations (filled: H < 10) | |||||||||||||||||||||||
| 0 | 0 |
|
|
|
|
|
|
| IPAIR | NAME | SHIFT | NEWSHIFT | S/N | NAME | SHIFT | NEWSHIFT | S/N |
| 0 | 02590028 | 0.414755 | 0.00000 | 18.9640 | 02590029 | 0.00282762 | 0.411927 | 18.9876 |
| 1 | 02590027 | 0.412252 | 0.00250298 | 19.0314 | 02590026 | 0.00000 | 0.414755 | 19.0948 |
| 2 | 02590032 | 0.414288 | 0.000466973 | 18.7512 | 02590030 | -0.00322996 | 0.417985 | 18.8823 |
| 3 | 02590031 | 0.413181 | 0.00157398 | 18.6523 | 02590033 | 0.000904663 | 0.413850 | 18.5468 |