| Red | Green | Blue | |
| z | 17.64 | ||
| znorm | Inf | ||
| sky | -NaN | -Inf | -Inf |
| S/N | 16.8 | 32.7 | 35.5 |
| S/N(c) | 0.0 | 0.0 | 0.0 |
| SN(E/C) |
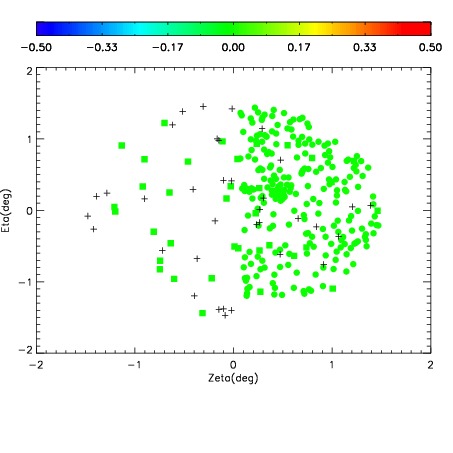
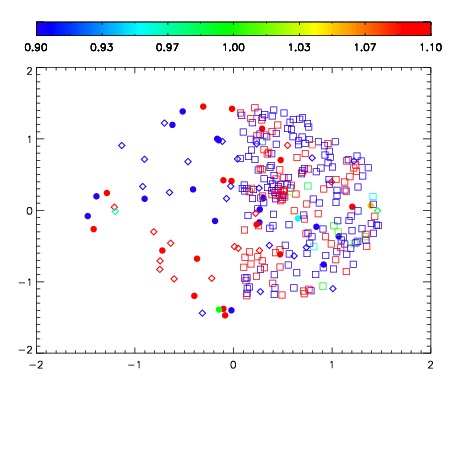
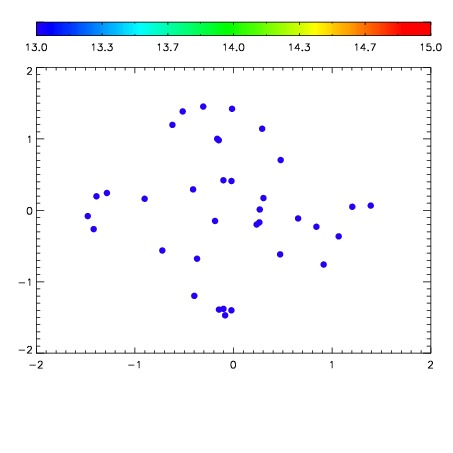

| Frame | Nreads | Zeropoints | Mag plots | Spatial mag deviation | Spatial sky 16325A emission deviations (filled: sky, open: star) | Spatial sky continuum emission | Spatial sky telluric CO2 absorption deviations (filled: H < 10) | |||||||||||||||||||||||
| 0 | 0 |
|
|
|
|
|
|
| IPAIR | NAME | SHIFT | NEWSHIFT | S/N | NAME | SHIFT | NEWSHIFT | S/N |
| 0 | 02620027 | 0.423923 | 0.00000 | 18.5348 | 02620029 | -0.00131944 | 0.425242 | 18.4373 |
| 1 | 02620026 | 0.419254 | 0.00466898 | 18.6876 | 02620025 | 0.00000 | 0.423923 | 18.6799 |
| 2 | 02620031 | 0.418168 | 0.00575498 | 18.2739 | 02620028 | 0.000761217 | 0.423162 | 18.3088 |
| 3 | 02620030 | 0.416433 | 0.00748998 | 18.2245 | 02620032 | -0.000469039 | 0.424392 | 18.2976 |