| Red | Green | Blue | |
| z | 17.64 | ||
| znorm | Inf | ||
| sky | -Inf | -Inf | -Inf |
| S/N | 15.6 | 26.2 | 27.3 |
| S/N(c) | 0.0 | 0.0 | 0.0 |
| SN(E/C) |
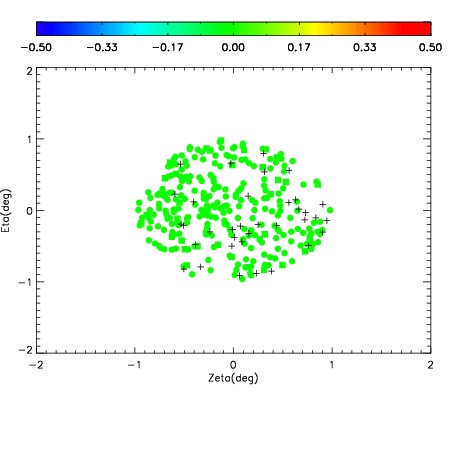
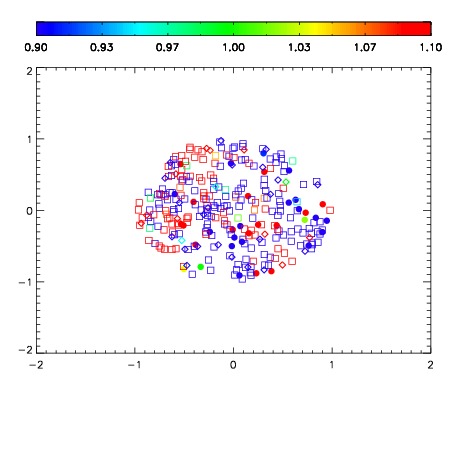


| Frame | Nreads | Zeropoints | Mag plots | Spatial mag deviation | Spatial sky 16325A emission deviations (filled: sky, open: star) | Spatial sky continuum emission | Spatial sky telluric CO2 absorption deviations (filled: H < 10) | |||||||||||||||||||||||
| 0 | 0 |
|
|
|
|
|
|
| IPAIR | NAME | SHIFT | NEWSHIFT | S/N | NAME | SHIFT | NEWSHIFT | S/N |
| 0 | 02480036 | 0.421353 | 0.00000 | 15.3930 | 02480035 | -0.00245593 | 0.423809 | 17.4807 |
| 1 | 02480032 | 0.416509 | 0.00484401 | 18.6836 | 02480031 | 0.00000 | 0.421353 | 18.7645 |
| 2 | 02480033 | 0.418346 | 0.00300702 | 18.5478 | 02480034 | 0.000355005 | 0.420998 | 18.5066 |