| Red | Green | Blue | |
| z | 17.64 | ||
| znorm | Inf | ||
| sky | -Inf | -Inf | -Inf |
| S/N | 19.4 | 31.9 | 34.4 |
| S/N(c) | 0.0 | 0.0 | 0.0 |
| SN(E/C) |
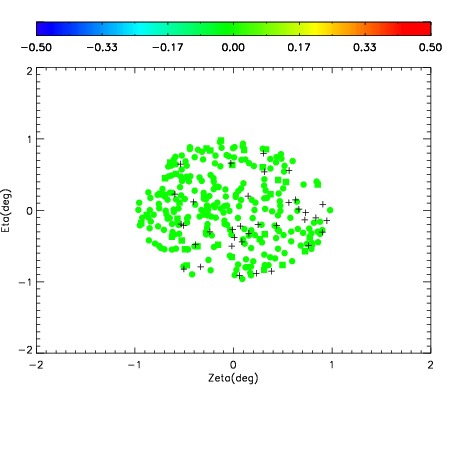
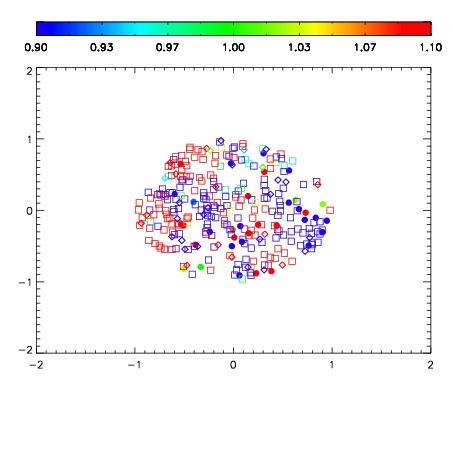
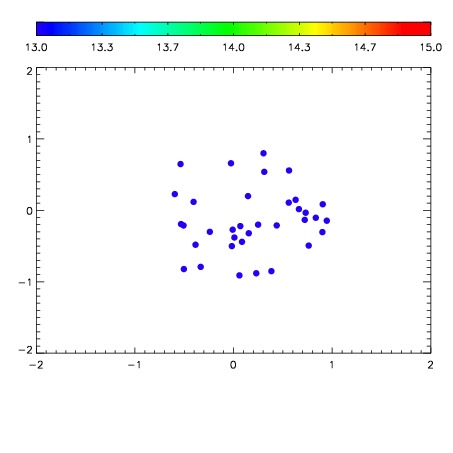

| Frame | Nreads | Zeropoints | Mag plots | Spatial mag deviation | Spatial sky 16325A emission deviations (filled: sky, open: star) | Spatial sky continuum emission | Spatial sky telluric CO2 absorption deviations (filled: H < 10) | |||||||||||||||||||||||
| 0 | 0 |
|
|
|
|
|
|
| IPAIR | NAME | SHIFT | NEWSHIFT | S/N | NAME | SHIFT | NEWSHIFT | S/N |
| 0 | 02490033 | 0.418956 | 0.00000 | 18.4579 | 02490035 | -0.000883955 | 0.419840 | 18.4319 |
| 1 | 02490032 | 0.418163 | 0.000793010 | 18.6755 | 02490031 | 0.00000 | 0.418956 | 18.6564 |
| 2 | 02490036 | 0.414458 | 0.00449800 | 18.3353 | 02490034 | 0.00262737 | 0.416329 | 18.3981 |
| 3 | 02490037 | 0.415210 | 0.00374600 | 18.2028 | 02490038 | 0.00157211 | 0.417384 | 17.9129 |
| 4 | 02490040 | 0.414193 | 0.00476301 | 17.3731 | 02490039 | -0.00143497 | 0.420391 | 17.6446 |
| 5 | 02490041 | 0.414711 | 0.00424501 | 17.0806 | 02490042 | -0.00160713 | 0.420563 | 16.7478 |