| Red | Green | Blue | |
| z | 17.64 | ||
| znorm | Inf | ||
| sky | -Inf | -Inf | -Inf |
| S/N | 9.7 | 16.8 | 16.9 |
| S/N(c) | 0.0 | 0.0 | 0.0 |
| SN(E/C) |
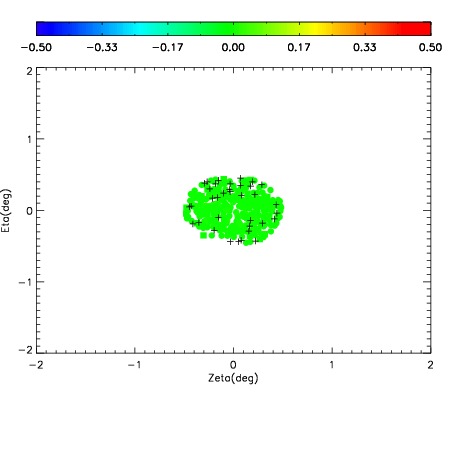
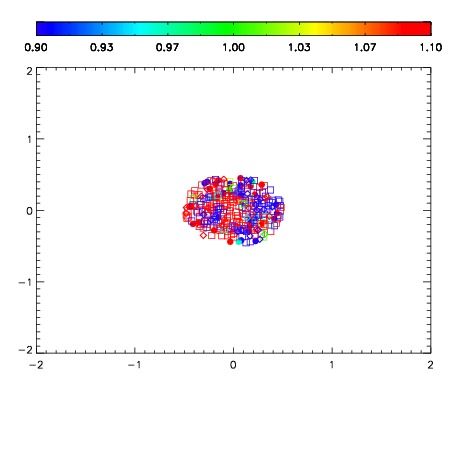
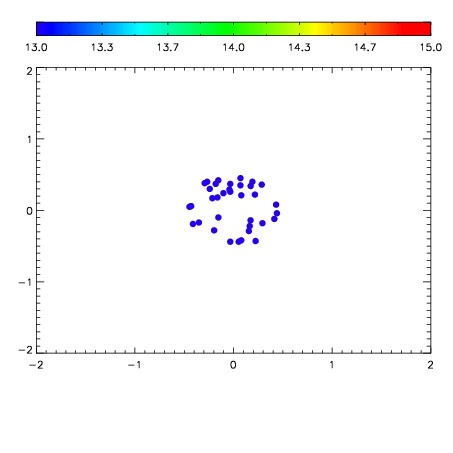

| Frame | Nreads | Zeropoints | Mag plots | Spatial mag deviation | Spatial sky 16325A emission deviations (filled: sky, open: star) | Spatial sky continuum emission | Spatial sky telluric CO2 absorption deviations (filled: H < 10) | |||||||||||||||||||||||
| 0 | 0 |
|
|
|
|
|
|
| IPAIR | NAME | SHIFT | NEWSHIFT | S/N | NAME | SHIFT | NEWSHIFT | S/N |
| 0 | 05210065 | 0.500996 | 0.00000 | 17.8090 | 05210066 | 0.00511877 | 0.495877 | 17.6199 |
| 1 | 05210064 | 0.500817 | 0.000178993 | 17.8471 | 05210063 | 0.00346287 | 0.497533 | 18.0015 |
| 2 | 05210060 | 0.499246 | 0.00174999 | 17.8382 | 05210062 | 0.00441955 | 0.496576 | 17.8418 |
| 3 | 05210061 | 0.500748 | 0.000248015 | 17.7824 | 05210059 | 0.00000 | 0.500996 | 17.5321 |