| Red | Green | Blue | |
| z | 17.64 | ||
| znorm | Inf | ||
| sky | -Inf | -Inf | -Inf |
| S/N | 16.4 | 30.5 | 33.3 |
| S/N(c) | 0.0 | 0.0 | 0.0 |
| SN(E/C) |
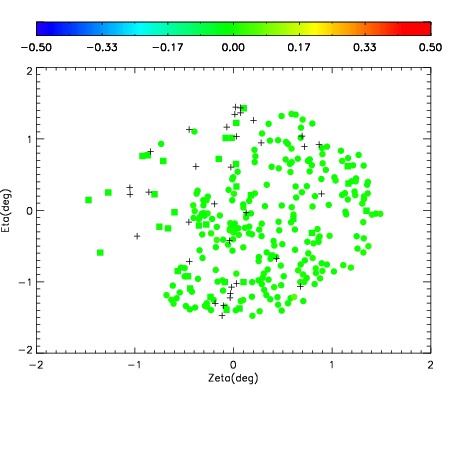
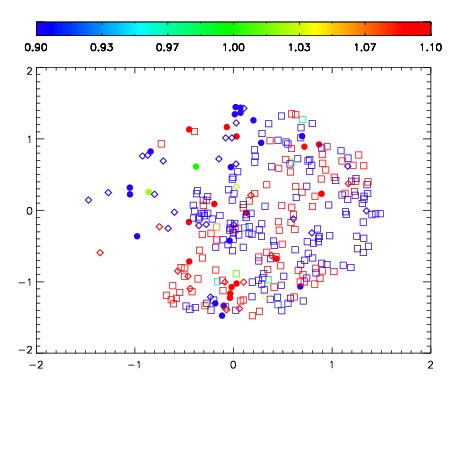
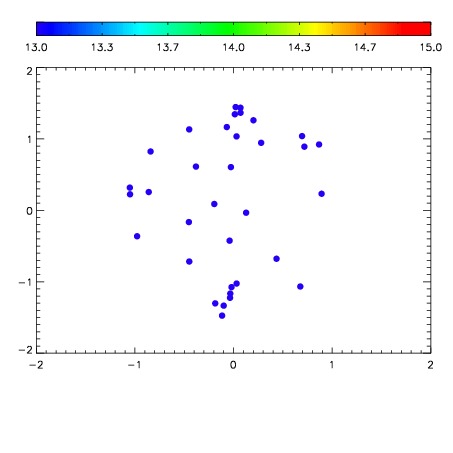

| Frame | Nreads | Zeropoints | Mag plots | Spatial mag deviation | Spatial sky 16325A emission deviations (filled: sky, open: star) | Spatial sky continuum emission | Spatial sky telluric CO2 absorption deviations (filled: H < 10) | |||||||||||||||||||||||
| 0 | 0 |
|
|
|
|
|
|
| IPAIR | NAME | SHIFT | NEWSHIFT | S/N | NAME | SHIFT | NEWSHIFT | S/N |
| 0 | 02530019 | 0.416084 | 0.00000 | 18.2013 | 02530021 | -5.78102e-05 | 0.416142 | 18.2837 |
| 1 | 02530018 | 0.414552 | 0.00153199 | 18.2791 | 02530020 | 0.00103020 | 0.415054 | 18.4076 |
| 2 | 02530022 | 0.411940 | 0.00414398 | 18.2138 | 02530017 | 0.00000 | 0.416084 | 18.3850 |
| 3 | 02530023 | 0.412365 | 0.00371900 | 18.1566 | 02530024 | 7.47254e-05 | 0.416009 | 17.9792 |