| Red | Green | Blue | |
| z | 17.64 | ||
| znorm | Inf | ||
| sky | -Inf | -Inf | -Inf |
| S/N | 13.7 | 27.4 | 28.8 |
| S/N(c) | 0.0 | 0.0 | 0.0 |
| SN(E/C) |
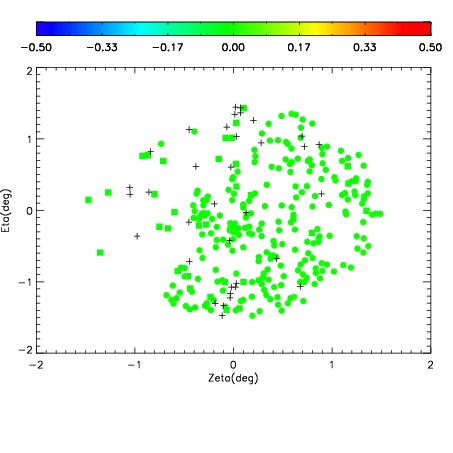
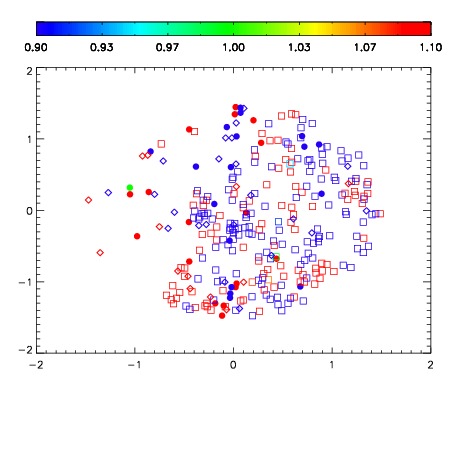
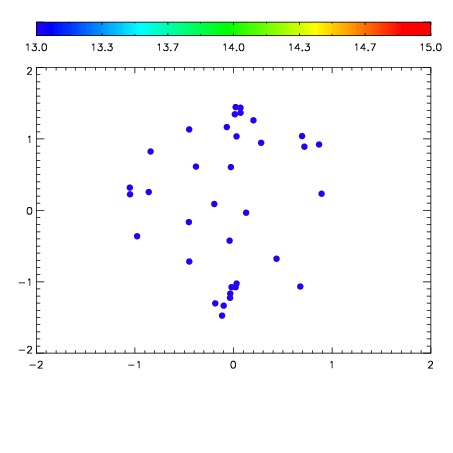

| Frame | Nreads | Zeropoints | Mag plots | Spatial mag deviation | Spatial sky 16325A emission deviations (filled: sky, open: star) | Spatial sky continuum emission | Spatial sky telluric CO2 absorption deviations (filled: H < 10) | |||||||||||||||||||||||
| 0 | 0 |
|
|
|
|
|
|
| IPAIR | NAME | SHIFT | NEWSHIFT | S/N | NAME | SHIFT | NEWSHIFT | S/N |
| 0 | 02600065 | 0.420396 | 0.00000 | 18.1334 | 02600066 | -0.00211887 | 0.422515 | 18.1443 |
| 1 | 02600061 | 0.419167 | 0.00122899 | 18.2453 | 02600063 | -0.000964397 | 0.421360 | 18.2364 |
| 2 | 02600060 | 0.418988 | 0.00140801 | 18.1582 | 02600062 | -0.000738872 | 0.421135 | 18.2150 |
| 3 | 02600064 | 0.419498 | 0.000898004 | 18.1326 | 02600059 | 0.00000 | 0.420396 | 18.1169 |