| Red | Green | Blue | |
| z | 17.64 | ||
| znorm | Inf | ||
| sky | -Inf | -Inf | -Inf |
| S/N | 16.9 | 31.4 | 32.9 |
| S/N(c) | 0.0 | 0.0 | 0.0 |
| SN(E/C) |

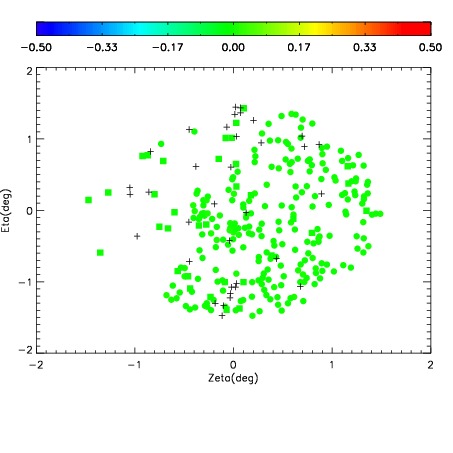
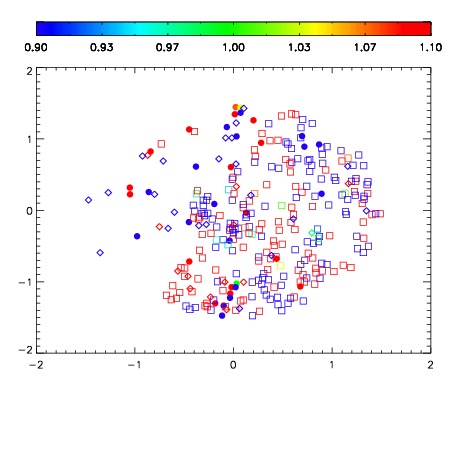


| Frame | Nreads | Zeropoints | Mag plots | Spatial mag deviation | Spatial sky 16325A emission deviations (filled: sky, open: star) | Spatial sky continuum emission | Spatial sky telluric CO2 absorption deviations (filled: H < 10) | |||||||||||||||||||||||
| 0 | 0 |
|
|
|
|
|
|
| IPAIR | NAME | SHIFT | NEWSHIFT | S/N | NAME | SHIFT | NEWSHIFT | S/N |
| 0 | 02790042 | 0.424824 | 0.00000 | 18.4964 | 02790039 | -0.00152923 | 0.426353 | 18.4250 |
| 1 | 02790038 | 0.421503 | 0.00332099 | 18.6318 | 02790043 | -9.30981e-05 | 0.424917 | 18.6575 |
| 2 | 02790041 | 0.416171 | 0.00865299 | 18.4197 | 02790040 | -0.00339521 | 0.428219 | 18.3108 |
| 3 | 02790037 | 0.417369 | 0.00745499 | 18.2950 | 02790036 | 0.00000 | 0.424824 | 18.0547 |