| Red | Green | Blue | |
| z | 17.64 | ||
| znorm | Inf | ||
| sky | -Inf | -Inf | -Inf |
| S/N | 25.0 | 42.4 | 45.7 |
| S/N(c) | 0.0 | 0.0 | 0.0 |
| SN(E/C) |
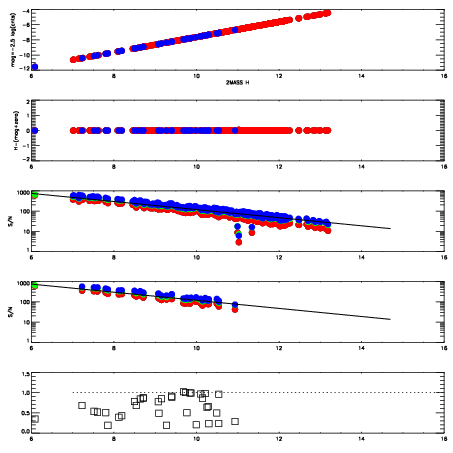

| Frame | Nreads | Zeropoints | Mag plots | Spatial mag deviation | Spatial sky 16325A emission deviations (filled: sky, open: star) | Spatial sky continuum emission | Spatial sky telluric CO2 absorption deviations (filled: H < 10) | |||||||||||||||||||||||
| 0 | 0 |
|
|
|
|
|
|
| IPAIR | NAME | SHIFT | NEWSHIFT | S/N | NAME | SHIFT | NEWSHIFT | S/N |
| 0 | 03040040 | 0.498302 | 0.00000 | 19.0349 | 03040037 | -0.00142614 | 0.499728 | 19.0453 |
| 1 | 03040036 | 0.497899 | 0.000403017 | 19.0104 | 03040038 | -0.00201782 | 0.500320 | 19.0307 |
| 2 | 03040035 | 0.497655 | 0.000647008 | 18.9624 | 03040041 | 0.000960365 | 0.497342 | 19.0244 |
| 3 | 03040039 | 0.496846 | 0.00145602 | 18.9431 | 03040034 | 0.00000 | 0.498302 | 18.9257 |