| Red | Green | Blue | |
| z | 17.64 | ||
| znorm | Inf | ||
| sky | -Inf | -Inf | -Inf |
| S/N | 19.7 | 35.6 | 38.5 |
| S/N(c) | 0.0 | 0.0 | 0.0 |
| SN(E/C) |
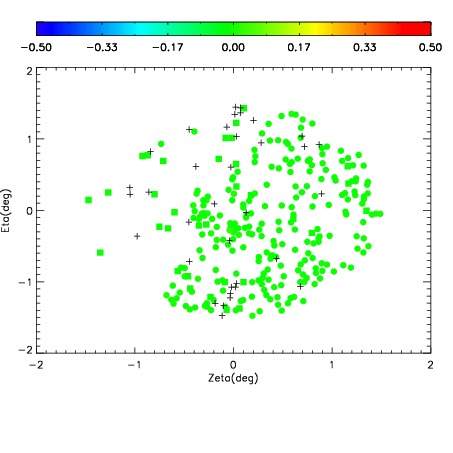
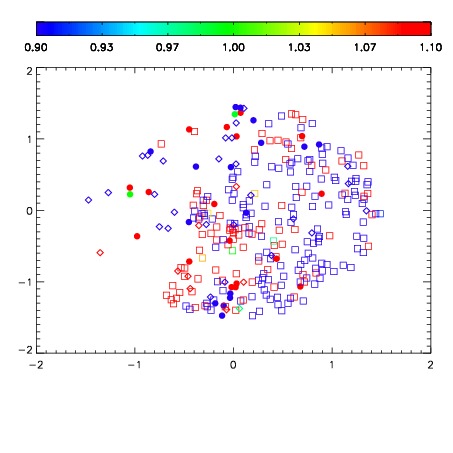
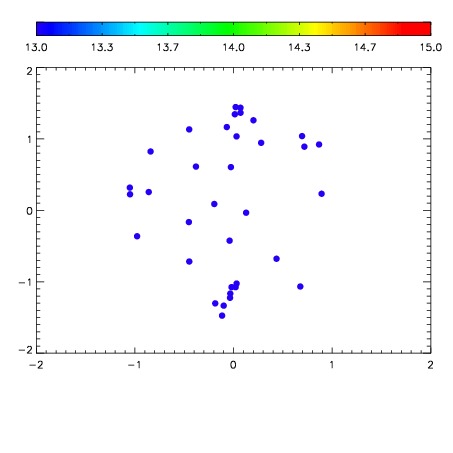

| Frame | Nreads | Zeropoints | Mag plots | Spatial mag deviation | Spatial sky 16325A emission deviations (filled: sky, open: star) | Spatial sky continuum emission | Spatial sky telluric CO2 absorption deviations (filled: H < 10) | |||||||||||||||||||||||
| 0 | 0 |
|
|
|
|
|
|
| IPAIR | NAME | SHIFT | NEWSHIFT | S/N | NAME | SHIFT | NEWSHIFT | S/N |
| 0 | 03140040 | 0.505405 | 0.00000 | 18.1211 | 03140041 | 0.000355182 | 0.505050 | 17.9410 |
| 1 | 03140036 | 0.497453 | 0.00795200 | 18.6542 | 03140034 | 0.00000 | 0.505405 | 18.7056 |
| 2 | 03140035 | 0.496875 | 0.00853002 | 18.6303 | 03140038 | 0.000390740 | 0.505014 | 18.6626 |
| 3 | 03140039 | 0.502955 | 0.00244999 | 18.5623 | 03140037 | 0.00148766 | 0.503917 | 18.5777 |
| 4 | 03140043 | 0.502537 | 0.00286800 | 18.2547 | 03140042 | -0.00177034 | 0.507175 | 18.1685 |