| Red | Green | Blue | |
| z | 17.64 | ||
| znorm | Inf | ||
| sky | -Inf | -Inf | -NaN |
| S/N | 23.3 | 40.5 | 42.4 |
| S/N(c) | 0.0 | 0.0 | 0.0 |
| SN(E/C) |
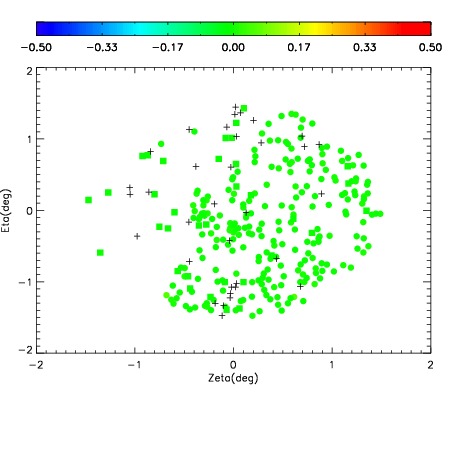
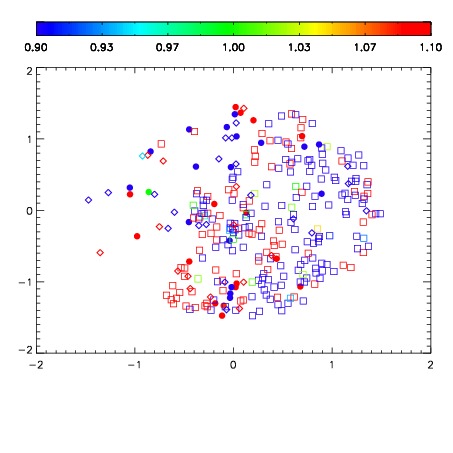


| Frame | Nreads | Zeropoints | Mag plots | Spatial mag deviation | Spatial sky 16325A emission deviations (filled: sky, open: star) | Spatial sky continuum emission | Spatial sky telluric CO2 absorption deviations (filled: H < 10) | |||||||||||||||||||||||
| 0 | 0 |
|
|
|
|
|
|
| IPAIR | NAME | SHIFT | NEWSHIFT | S/N | NAME | SHIFT | NEWSHIFT | S/N |
| 0 | 10910013 | 0.512215 | 0.00000 | 18.8443 | 10910014 | -0.000871309 | 0.513086 | 18.8874 |
| 1 | 10910012 | 0.511563 | 0.000652015 | 18.8445 | 10910015 | -0.000907878 | 0.513123 | 18.9154 |
| 2 | 10910017 | 0.510907 | 0.00130802 | 18.8335 | 10910018 | -0.00112470 | 0.513340 | 18.7456 |
| 3 | 10910016 | 0.509319 | 0.00289601 | 18.8021 | 10910011 | 0.00000 | 0.512215 | 18.6496 |