| Red | Green | Blue | |
| z | 17.64 | ||
| znorm | Inf | ||
| sky | -Inf | -Inf | -NaN |
| S/N | 22.6 | 39.1 | 40.9 |
| S/N(c) | 0.0 | 0.0 | 0.0 |
| SN(E/C) |
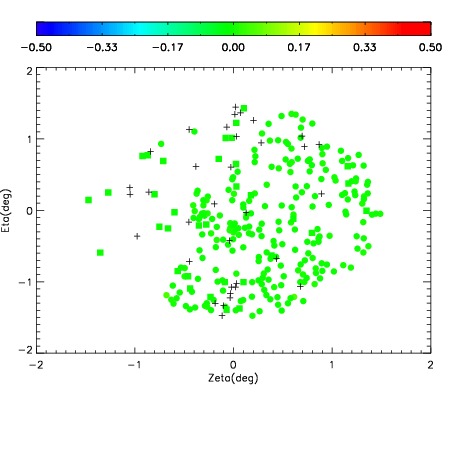
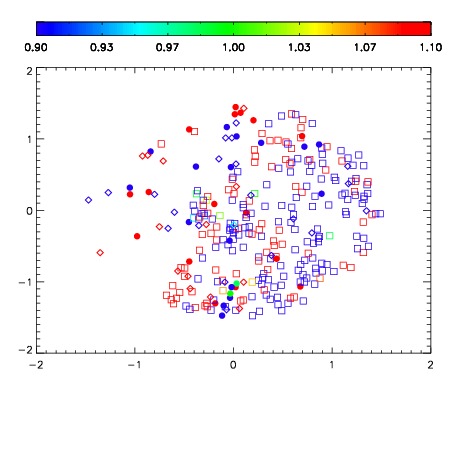
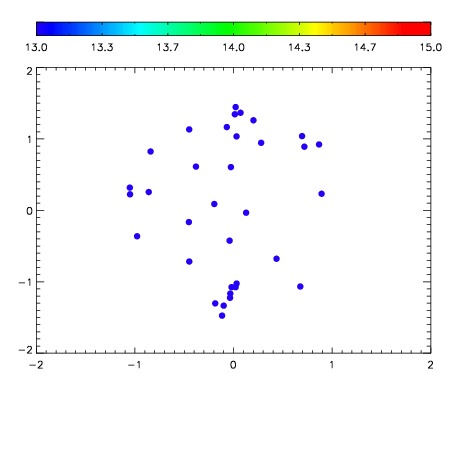

| Frame | Nreads | Zeropoints | Mag plots | Spatial mag deviation | Spatial sky 16325A emission deviations (filled: sky, open: star) | Spatial sky continuum emission | Spatial sky telluric CO2 absorption deviations (filled: H < 10) | |||||||||||||||||||||||
| 0 | 0 |
|
|
|
|
|
|
| IPAIR | NAME | SHIFT | NEWSHIFT | S/N | NAME | SHIFT | NEWSHIFT | S/N |
| 0 | 10920017 | 0.515756 | 0.00000 | 18.7948 | 10920014 | -0.00416093 | 0.519917 | 18.7538 |
| 1 | 10920016 | 0.515251 | 0.000505030 | 18.9904 | 10920015 | -0.00434584 | 0.520102 | 18.9264 |
| 2 | 10920013 | 0.514716 | 0.00103998 | 18.7119 | 10920011 | 0.00000 | 0.515756 | 18.7155 |
| 3 | 10920012 | 0.515402 | 0.000353992 | 18.5370 | 10920018 | -0.00392222 | 0.519678 | 18.6593 |