| Red | Green | Blue | |
| z | 17.64 | ||
| znorm | Inf | ||
| sky | -Inf | -Inf | -Inf |
| S/N | 18.2 | 32.5 | 34.0 |
| S/N(c) | 0.0 | 0.0 | 0.0 |
| SN(E/C) |
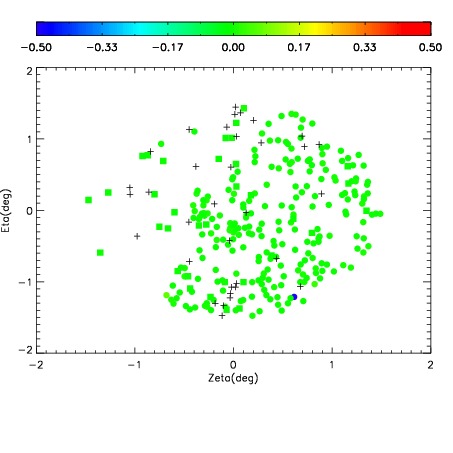
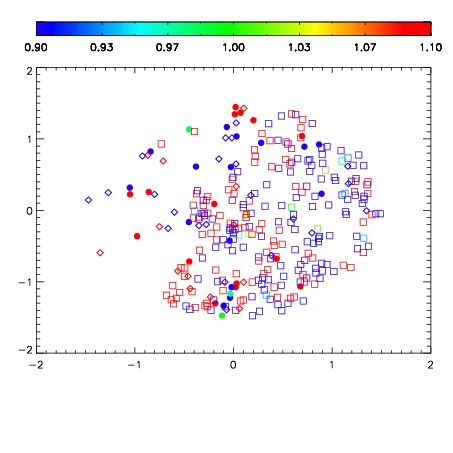
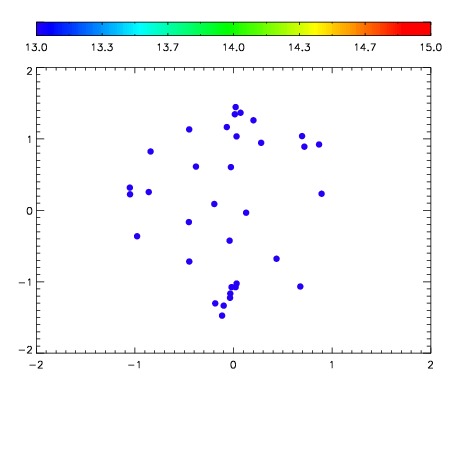

| Frame | Nreads | Zeropoints | Mag plots | Spatial mag deviation | Spatial sky 16325A emission deviations (filled: sky, open: star) | Spatial sky continuum emission | Spatial sky telluric CO2 absorption deviations (filled: H < 10) | |||||||||||||||||||||||
| 0 | 0 |
|
|
|
|
|
|
| IPAIR | NAME | SHIFT | NEWSHIFT | S/N | NAME | SHIFT | NEWSHIFT | S/N |
| 0 | 10930017 | 0.513863 | 0.00000 | 17.9399 | 10930015 | -0.00448867 | 0.518352 | 17.9211 |
| 1 | 10930012 | 0.509492 | 0.00437105 | 18.8328 | 10930011 | 0.00000 | 0.513863 | 18.6872 |
| 2 | 10930013 | 0.509804 | 0.00405902 | 18.7624 | 10930014 | -0.00546007 | 0.519323 | 18.6707 |
| 3 | 10930016 | 0.512050 | 0.00181305 | 18.0425 | 10930018 | -0.00125430 | 0.515117 | 18.1306 |