| Red | Green | Blue | |
| z | 17.64 | ||
| znorm | Inf | ||
| sky | -Inf | -Inf | -Inf |
| S/N | 31.4 | 45.2 | 47.6 |
| S/N(c) | 0.0 | 0.0 | 0.0 |
| SN(E/C) |


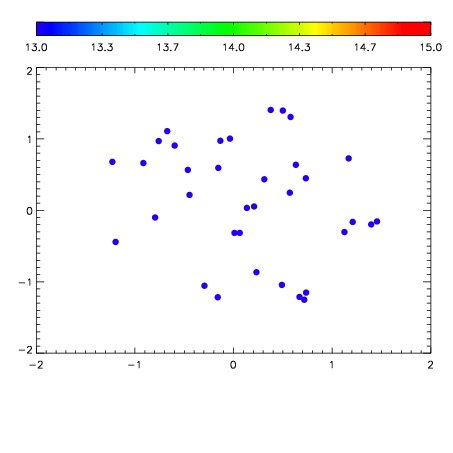

| Frame | Nreads | Zeropoints | Mag plots | Spatial mag deviation | Spatial sky 16325A emission deviations (filled: sky, open: star) | Spatial sky continuum emission | Spatial sky telluric CO2 absorption deviations (filled: H < 10) | |||||||||||||||||||||||
| 0 | 0 |
|
|
|
|
|
|
| IPAIR | NAME | SHIFT | NEWSHIFT | S/N | NAME | SHIFT | NEWSHIFT | S/N |
| 0 | 02820015 | 0.405295 | 0.00000 | 19.1845 | 02820013 | 0.000553049 | 0.404742 | 19.1806 |
| 1 | 02820014 | 0.402890 | 0.00240502 | 19.1891 | 02820012 | 0.00218009 | 0.403115 | 19.2114 |
| 2 | 02820011 | 0.405049 | 0.000246018 | 19.1835 | 02820016 | 0.00177197 | 0.403523 | 19.0979 |
| 3 | 02820010 | 0.403678 | 0.00161701 | 19.1411 | 02820009 | 0.00000 | 0.405295 | 19.0949 |