| Red | Green | Blue | |
| z | 17.64 | ||
| znorm | Inf | ||
| sky | -Inf | -NaN | -Inf |
| S/N | 17.9 | 28.6 | 36.1 |
| S/N(c) | 0.0 | 0.0 | 0.0 |
| SN(E/C) |
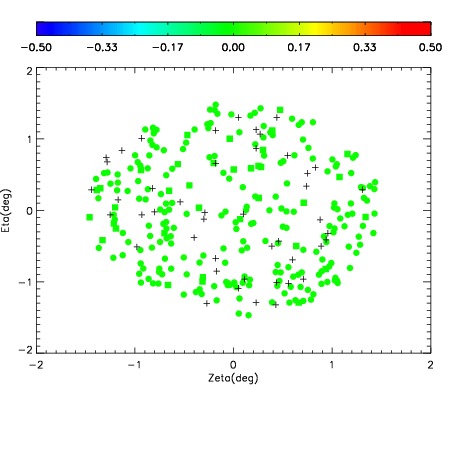

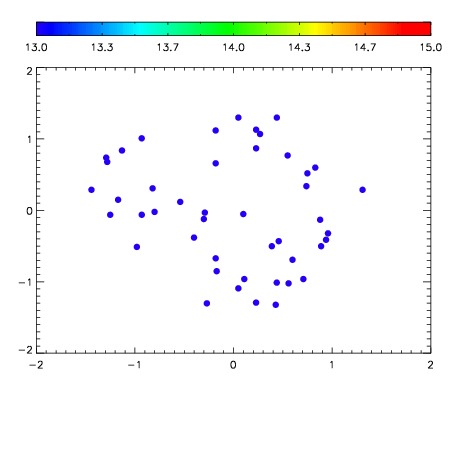

| Frame | Nreads | Zeropoints | Mag plots | Spatial mag deviation | Spatial sky 16325A emission deviations (filled: sky, open: star) | Spatial sky continuum emission | Spatial sky telluric CO2 absorption deviations (filled: H < 10) | |||||||||||||||||||||||
| 0 | 0 |
|
|
|
|
|
|
| IPAIR | NAME | SHIFT | NEWSHIFT | S/N | NAME | SHIFT | NEWSHIFT | S/N |
| 0 | 02560015 | 0.409501 | 0.00000 | 18.6606 | 02560016 | 0.00272835 | 0.406773 | 18.7525 |
| 1 | 02560019 | 0.407892 | 0.00160900 | 18.8238 | 02560017 | 0.00122779 | 0.408273 | 18.8055 |
| 2 | 02560018 | 0.407551 | 0.00195000 | 18.5648 | 02560013 | 0.00000 | 0.409501 | 18.6433 |
| 3 | 02560014 | 0.407648 | 0.00185299 | 18.3787 | 02560020 | 0.00276318 | 0.406738 | 18.3276 |