| Red | Green | Blue | |
| z | 17.64 | ||
| znorm | Inf | ||
| sky | -NaN | -NaN | -Inf |
| S/N | 13.3 | 21.1 | 21.3 |
| S/N(c) | 0.0 | 0.0 | 0.0 |
| SN(E/C) |
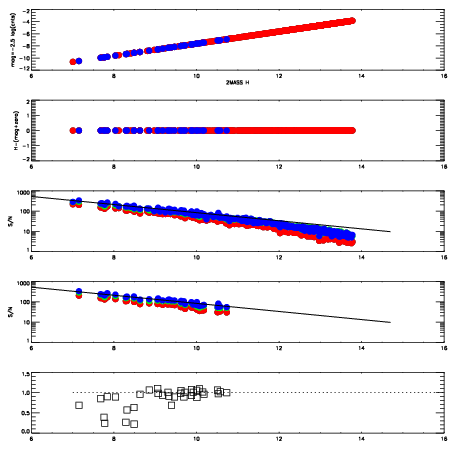


| Frame | Nreads | Zeropoints | Mag plots | Spatial mag deviation | Spatial sky 16325A emission deviations (filled: sky, open: star) | Spatial sky continuum emission | Spatial sky telluric CO2 absorption deviations (filled: H < 10) | |||||||||||||||||||||||
| 0 | 0 |
|
|
|
|
|
|
| IPAIR | NAME | SHIFT | NEWSHIFT | S/N | NAME | SHIFT | NEWSHIFT | S/N |
| 0 | 04900082 | 0.484878 | 0.00000 | 18.1197 | 04900083 | -0.000155664 | 0.485034 | 18.0205 |
| 1 | 04900081 | 0.484161 | 0.000717014 | 18.5187 | 04900080 | 0.00000 | 0.484878 | 18.5219 |