| Red | Green | Blue | |
| z | 17.64 | ||
| znorm | Inf | ||
| sky | -NaN | -NaN | -Inf |
| S/N | 28.6 | 42.6 | 43.8 |
| S/N(c) | 0.0 | 0.0 | 0.0 |
| SN(E/C) |

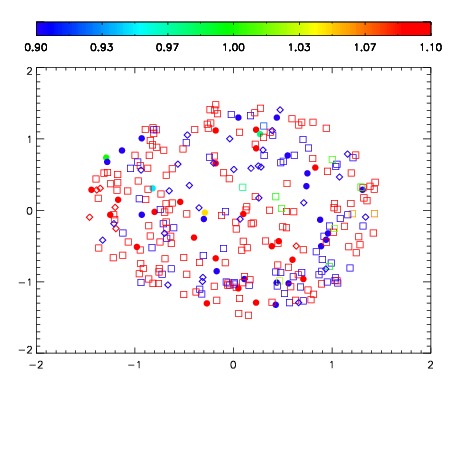


| Frame | Nreads | Zeropoints | Mag plots | Spatial mag deviation | Spatial sky 16325A emission deviations (filled: sky, open: star) | Spatial sky continuum emission | Spatial sky telluric CO2 absorption deviations (filled: H < 10) | |||||||||||||||||||||||
| 0 | 0 |
|
|
|
|
|
|
| IPAIR | NAME | SHIFT | NEWSHIFT | S/N | NAME | SHIFT | NEWSHIFT | S/N |
| 0 | 05220054 | 0.497904 | 0.00000 | 19.0049 | 05220059 | 0.00135802 | 0.496546 | 19.0116 |
| 1 | 05220057 | 0.494590 | 0.00331399 | 19.0785 | 05220055 | -0.00294163 | 0.500846 | 19.0851 |
| 2 | 05220058 | 0.495367 | 0.00253701 | 19.0604 | 05220056 | 0.000225292 | 0.497679 | 19.0678 |
| 3 | 05220053 | 0.496983 | 0.000921011 | 18.9381 | 05220052 | 0.00000 | 0.497904 | 18.9550 |