| Red | Green | Blue | |
| z | 17.64 | ||
| znorm | Inf | ||
| sky | -NaN | -NaN | -Inf |
| S/N | 23.7 | 37.1 | 37.4 |
| S/N(c) | 0.0 | 0.0 | 0.0 |
| SN(E/C) |
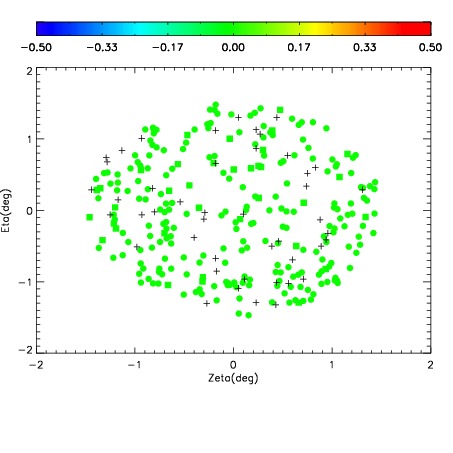
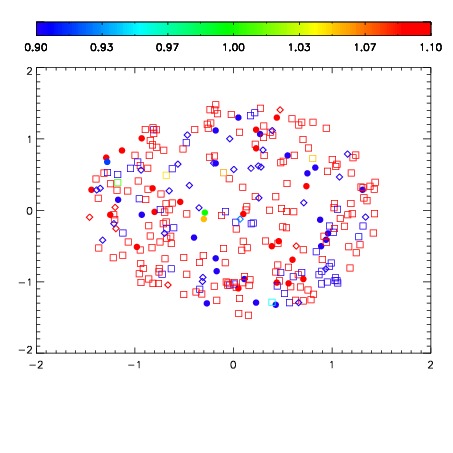
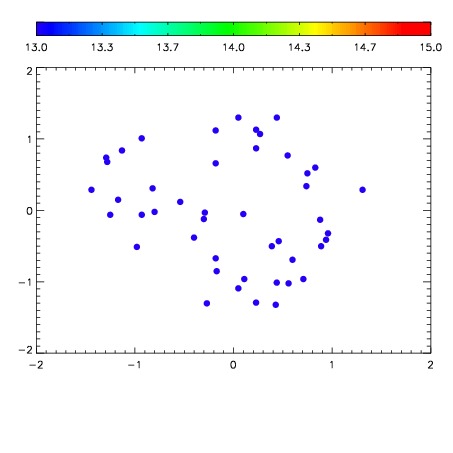

| Frame | Nreads | Zeropoints | Mag plots | Spatial mag deviation | Spatial sky 16325A emission deviations (filled: sky, open: star) | Spatial sky continuum emission | Spatial sky telluric CO2 absorption deviations (filled: H < 10) | |||||||||||||||||||||||
| 0 | 0 |
|
|
|
|
|
|
| IPAIR | NAME | SHIFT | NEWSHIFT | S/N | NAME | SHIFT | NEWSHIFT | S/N |
| 0 | 08490061 | 0.484650 | 0.00000 | 18.9021 | 08490063 | 0.00290270 | 0.481747 | 18.9521 |
| 1 | 08490064 | 0.483641 | 0.00100899 | 18.8914 | 08490062 | 0.00316410 | 0.481486 | 18.8991 |
| 2 | 08490060 | 0.484436 | 0.000213981 | 18.8679 | 08490059 | 0.00000 | 0.484650 | 18.8336 |