| Red | Green | Blue | |
| z | 17.64 | ||
| znorm | Inf | ||
| sky | -Inf | -Inf | -Inf |
| S/N | 26.6 | 42.4 | 42.4 |
| S/N(c) | 0.0 | 0.0 | 0.0 |
| SN(E/C) |

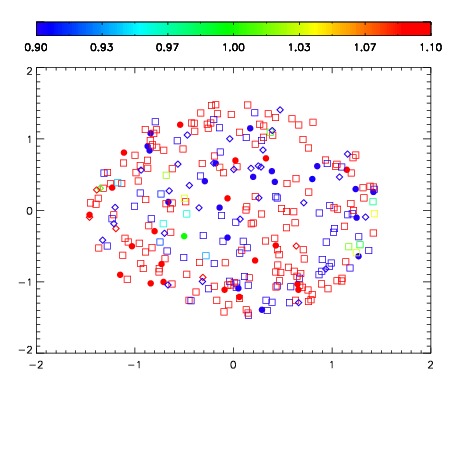
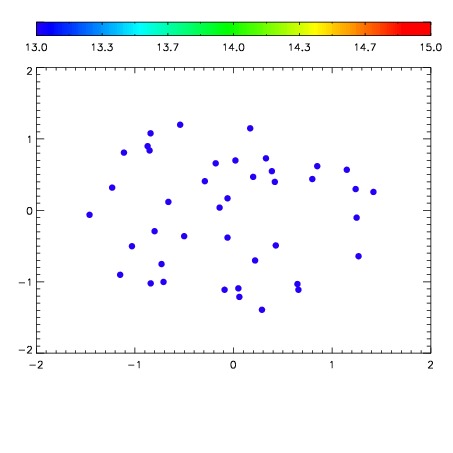

| Frame | Nreads | Zeropoints | Mag plots | Spatial mag deviation | Spatial sky 16325A emission deviations (filled: sky, open: star) | Spatial sky continuum emission | Spatial sky telluric CO2 absorption deviations (filled: H < 10) | |||||||||||||||||||||||
| 0 | 0 |
|
|
|
|
|
|
| IPAIR | NAME | SHIFT | NEWSHIFT | S/N | NAME | SHIFT | NEWSHIFT | S/N |
| 0 | 08500071 | 0.491227 | 0.00000 | 18.8586 | 08500074 | 0.00369415 | 0.487533 | 18.8353 |
| 1 | 08500075 | 0.489027 | 0.00220001 | 18.8690 | 08500073 | 0.00503944 | 0.486188 | 18.8599 |
| 2 | 08500072 | 0.490935 | 0.000292003 | 18.8401 | 08500069 | 0.00320600 | 0.488021 | 18.7929 |
| 3 | 08500067 | 0.488382 | 0.00284499 | 18.8237 | 08500066 | 0.00000 | 0.491227 | 18.7705 |
| 4 | 08500068 | 0.489663 | 0.00156400 | 18.7509 | 08500070 | 0.00464264 | 0.486584 | 18.6419 |