| Red | Green | Blue | |
| z | 17.64 | ||
| znorm | Inf | ||
| sky | -Inf | -NaN | -Inf |
| S/N | 24.1 | 38.6 | 44.5 |
| S/N(c) | 0.0 | 0.0 | 0.0 |
| SN(E/C) |

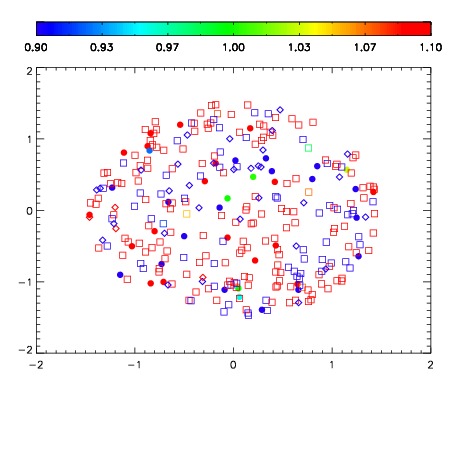
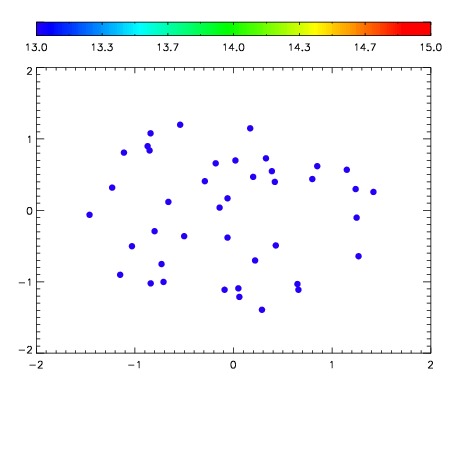

| Frame | Nreads | Zeropoints | Mag plots | Spatial mag deviation | Spatial sky 16325A emission deviations (filled: sky, open: star) | Spatial sky continuum emission | Spatial sky telluric CO2 absorption deviations (filled: H < 10) | |||||||||||||||||||||||
| 0 | 0 |
|
|
|
|
|
|
| IPAIR | NAME | SHIFT | NEWSHIFT | S/N | NAME | SHIFT | NEWSHIFT | S/N |
| 0 | 08810028 | 0.482425 | 0.00000 | 18.8935 | 08810026 | 0.00000 | 0.482425 | 18.8349 |
| 1 | 08810032 | 0.480031 | 0.00239399 | 18.9785 | 08810030 | 0.00194153 | 0.480483 | 18.9646 |
| 2 | 08810031 | 0.479765 | 0.00266001 | 18.9581 | 08810033 | 0.00113032 | 0.481295 | 18.9577 |
| 3 | 08810027 | 0.481744 | 0.000681013 | 18.9301 | 08810029 | 0.00172389 | 0.480701 | 18.8870 |