| Red | Green | Blue | |
| z | 17.64 | ||
| znorm | Inf | ||
| sky | -Inf | -Inf | -Inf |
| S/N | 28.9 | 47.6 | 49.6 |
| S/N(c) | 0.0 | 0.0 | 0.0 |
| SN(E/C) |
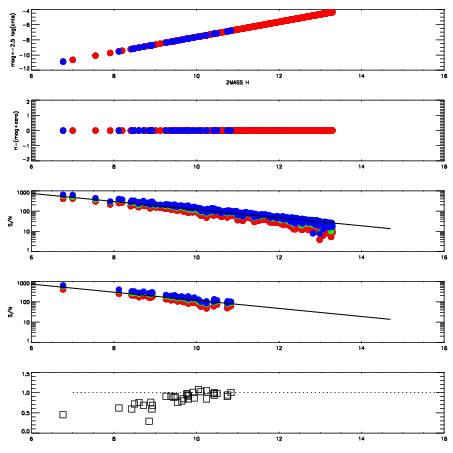
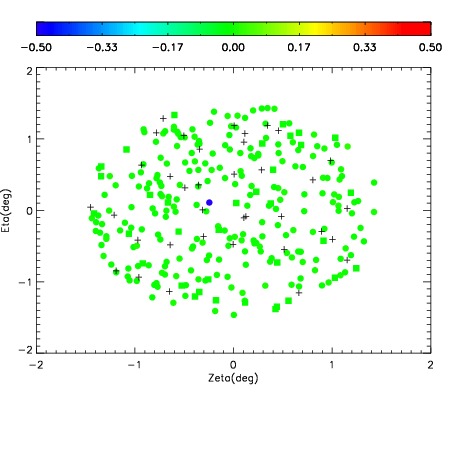
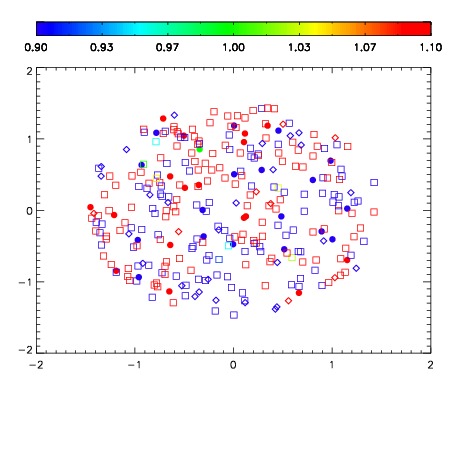
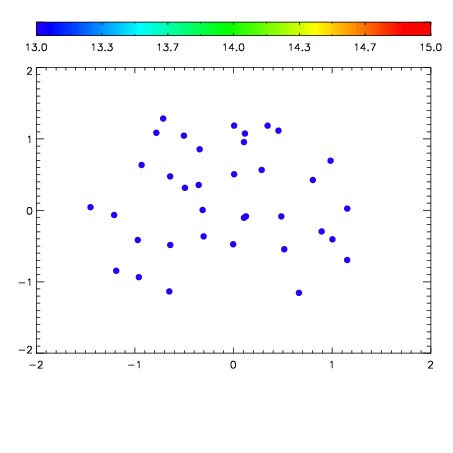

| Frame | Nreads | Zeropoints | Mag plots | Spatial mag deviation | Spatial sky 16325A emission deviations (filled: sky, open: star) | Spatial sky continuum emission | Spatial sky telluric CO2 absorption deviations (filled: H < 10) | |||||||||||||||||||||||
| 0 | 0 |
|
|
|
|
|
|
| IPAIR | NAME | SHIFT | NEWSHIFT | S/N | NAME | SHIFT | NEWSHIFT | S/N |
| 0 | 09810013 | 0.520321 | 0.00000 | 19.0431 | 09810011 | 0.00000 | 0.520321 | 19.0682 |
| 1 | 09810012 | 0.520286 | 3.49879e-05 | 19.0325 | 09810015 | -0.00207878 | 0.522400 | 19.0630 |
| 2 | 09810016 | 0.519509 | 0.000811994 | 18.9089 | 09810014 | -0.00183369 | 0.522155 | 19.0532 |
| 3 | 09810017 | 0.520083 | 0.000238001 | 18.8763 | 09810018 | -0.00214481 | 0.522466 | 18.8903 |