| Red | Green | Blue | |
| z | 17.64 | ||
| znorm | Inf | ||
| sky | -Inf | -Inf | -Inf |
| S/N | 29.2 | 46.2 | 48.9 |
| S/N(c) | 0.0 | 0.0 | 0.0 |
| SN(E/C) |
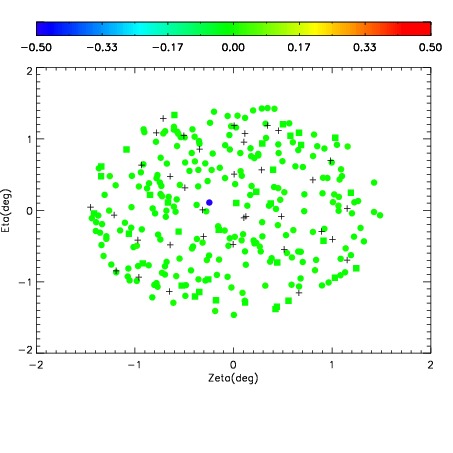
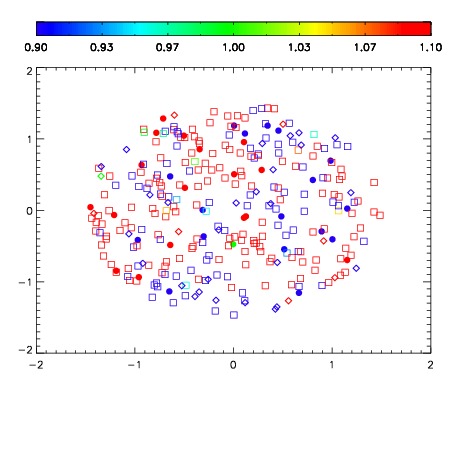
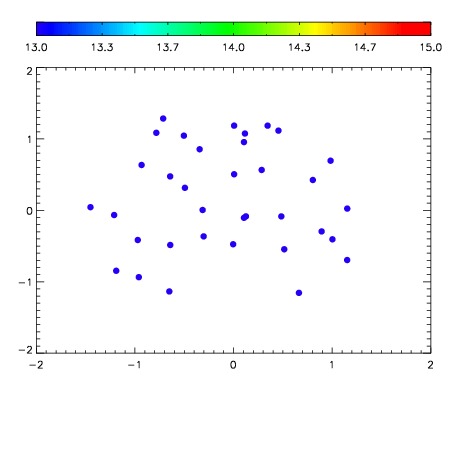

| Frame | Nreads | Zeropoints | Mag plots | Spatial mag deviation | Spatial sky 16325A emission deviations (filled: sky, open: star) | Spatial sky continuum emission | Spatial sky telluric CO2 absorption deviations (filled: H < 10) | |||||||||||||||||||||||
| 0 | 0 |
|
|
|
|
|
|
| IPAIR | NAME | SHIFT | NEWSHIFT | S/N | NAME | SHIFT | NEWSHIFT | S/N |
| 0 | 12180039 | 0.498485 | 0.00000 | 19.0866 | 12180037 | -0.000239940 | 0.498725 | 19.0849 |
| 1 | 12180038 | 0.497879 | 0.000606000 | 19.1063 | 12180040 | -0.000295315 | 0.498780 | 19.1040 |
| 2 | 12180035 | 0.497994 | 0.000490993 | 19.0586 | 12180036 | -0.000464980 | 0.498950 | 19.0587 |
| 3 | 12180034 | 0.498167 | 0.000317991 | 18.9888 | 12180033 | 0.00000 | 0.498485 | 18.9082 |