| Red | Green | Blue | |
| z | 17.64 | ||
| znorm | Inf | ||
| sky | -Inf | -Inf | -Inf |
| S/N | 24.1 | 39.2 | 44.5 |
| S/N(c) | 0.0 | 0.0 | 0.0 |
| SN(E/C) |
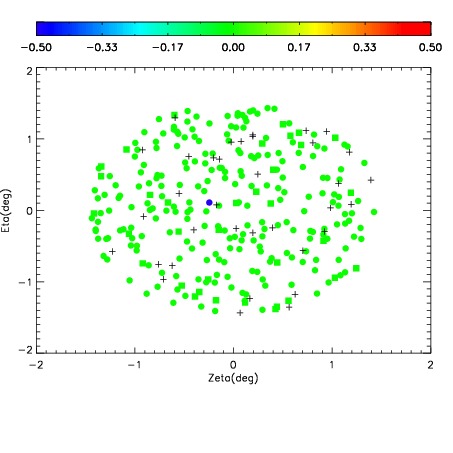
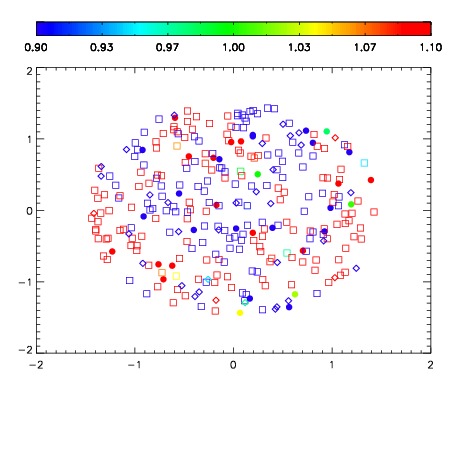
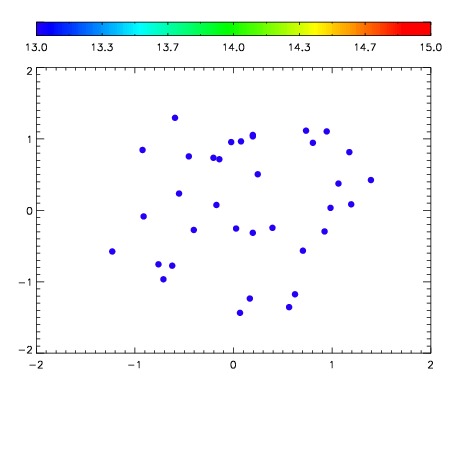

| Frame | Nreads | Zeropoints | Mag plots | Spatial mag deviation | Spatial sky 16325A emission deviations (filled: sky, open: star) | Spatial sky continuum emission | Spatial sky telluric CO2 absorption deviations (filled: H < 10) | |||||||||||||||||||||||
| 0 | 0 |
|
|
|
|
|
|
| IPAIR | NAME | SHIFT | NEWSHIFT | S/N | NAME | SHIFT | NEWSHIFT | S/N |
| 0 | 09820016 | 0.526037 | 0.00000 | 18.9182 | 09820015 | 0.00150619 | 0.524531 | 18.9135 |
| 1 | 09820013 | 0.522482 | 0.00355500 | 18.9167 | 09820018 | 0.00167268 | 0.524364 | 18.8751 |
| 2 | 09820012 | 0.523118 | 0.00291896 | 18.9069 | 09820014 | 0.00151790 | 0.524519 | 18.8748 |
| 3 | 09820017 | 0.525680 | 0.000356972 | 18.8519 | 09820011 | 0.00000 | 0.526037 | 18.8431 |