| Red | Green | Blue | |
| z | 17.63 | ||
| znorm | Inf | ||
| sky | -NaN | -NaN | -Inf |
| S/N | 22.3 | 37.1 | 40.7 |
| S/N(c) | 0.0 | 0.0 | 0.0 |
| SN(E/C) |
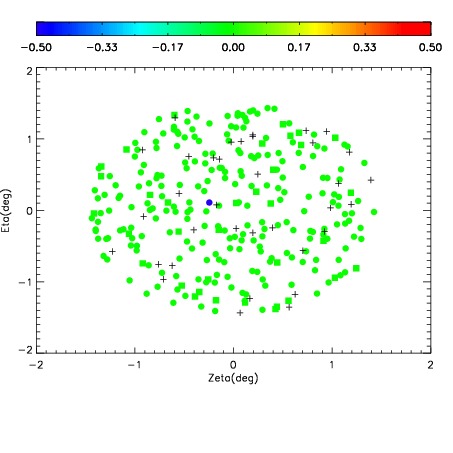
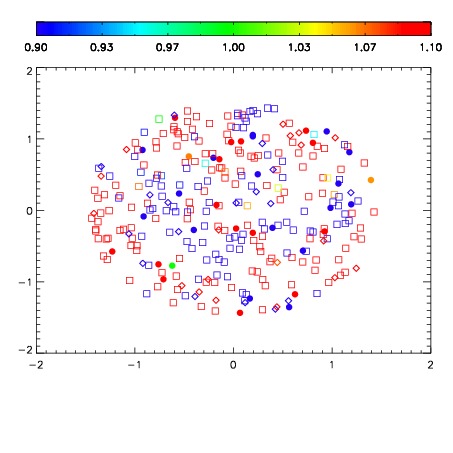


| Frame | Nreads | Zeropoints | Mag plots | Spatial mag deviation | Spatial sky 16325A emission deviations (filled: sky, open: star) | Spatial sky continuum emission | Spatial sky telluric CO2 absorption deviations (filled: H < 10) | |||||||||||||||||||||||
| 0 | 0 |
|
|
|
|
|
|
| IPAIR | NAME | SHIFT | NEWSHIFT | S/N | NAME | SHIFT | NEWSHIFT | S/N |
| 0 | 09970017 | 0.522829 | 0.00000 | 18.9130 | 09970015 | -4.72719e-05 | 0.522876 | 18.8748 |
| 1 | 09970016 | 0.522276 | 0.000553012 | 18.8749 | 09970018 | 0.00150584 | 0.521323 | 18.8395 |
| 2 | 09970013 | 0.521673 | 0.00115597 | 18.8464 | 09970014 | 0.000206255 | 0.522623 | 18.8224 |
| 3 | 09970012 | 0.521601 | 0.00122797 | 18.7751 | 09970011 | 0.00000 | 0.522829 | 18.7302 |