| Red | Green | Blue | |
| z | 17.63 | ||
| znorm | Inf | ||
| sky | -NaN | -NaN | -NaN |
| S/N | 17.7 | 31.4 | 31.1 |
| S/N(c) | 0.0 | 0.0 | 0.0 |
| SN(E/C) |
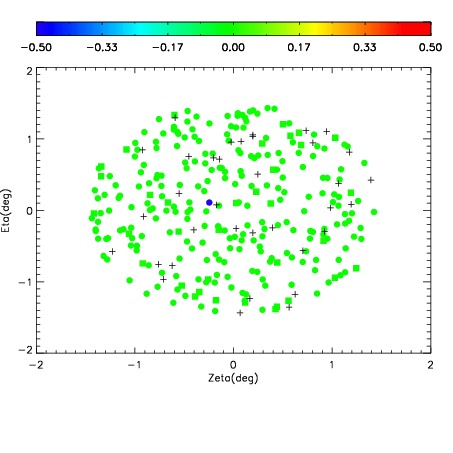
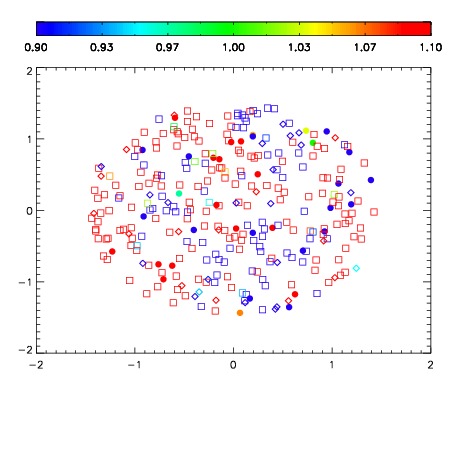
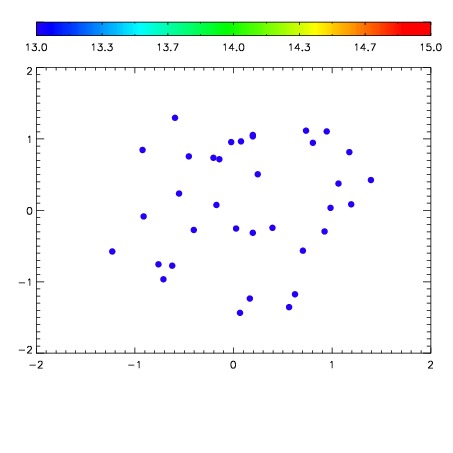

| Frame | Nreads | Zeropoints | Mag plots | Spatial mag deviation | Spatial sky 16325A emission deviations (filled: sky, open: star) | Spatial sky continuum emission | Spatial sky telluric CO2 absorption deviations (filled: H < 10) | |||||||||||||||||||||||
| 0 | 0 |
|
|
|
|
|
|
| IPAIR | NAME | SHIFT | NEWSHIFT | S/N | NAME | SHIFT | NEWSHIFT | S/N |
| 0 | 12130038 | 0.496728 | 0.00000 | 18.4855 | 12130037 | 0.00000 | 0.496728 | 18.4678 |
| 1 | 12130043 | 0.494542 | 0.00218600 | 18.6382 | 12130044 | -0.00144434 | 0.498172 | 18.7002 |
| 2 | 12130042 | 0.494503 | 0.00222501 | 18.5895 | 12130041 | -0.00175058 | 0.498479 | 18.5916 |
| 3 | 12130039 | 0.496247 | 0.000481009 | 18.3113 | 12130040 | -0.00137815 | 0.498106 | 18.3497 |