| Red | Green | Blue | |
| z | 17.64 | ||
| znorm | Inf | ||
| sky | -Inf | -Inf | -Inf |
| S/N | 23.6 | 37.7 | 38.6 |
| S/N(c) | 0.0 | 0.0 | 0.0 |
| SN(E/C) |
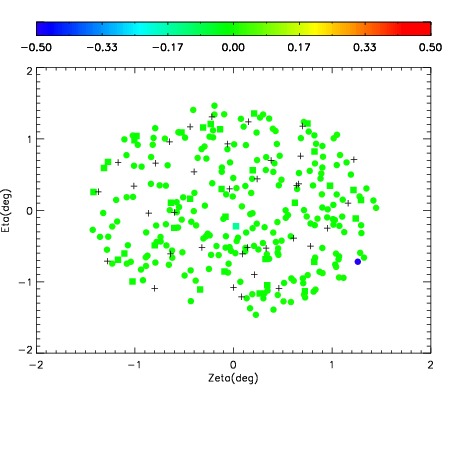
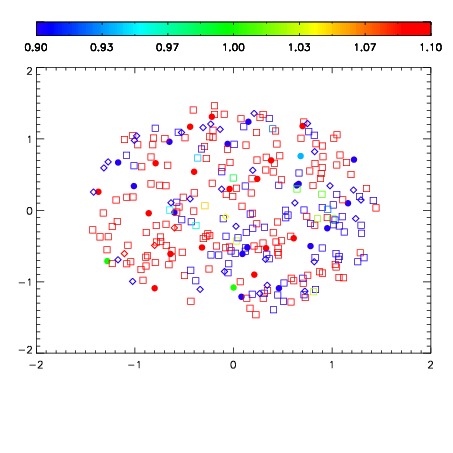
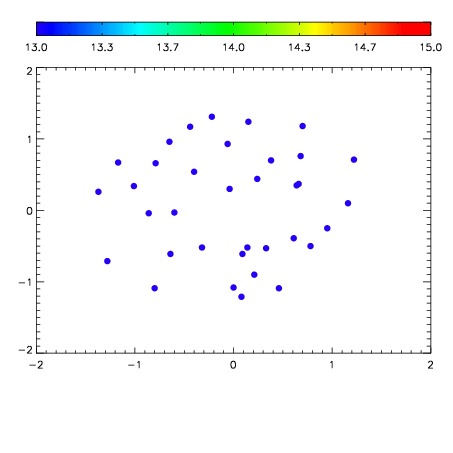

| Frame | Nreads | Zeropoints | Mag plots | Spatial mag deviation | Spatial sky 16325A emission deviations (filled: sky, open: star) | Spatial sky continuum emission | Spatial sky telluric CO2 absorption deviations (filled: H < 10) | |||||||||||||||||||||||
| 0 | 0 |
|
|
|
|
|
|
| IPAIR | NAME | SHIFT | NEWSHIFT | S/N | NAME | SHIFT | NEWSHIFT | S/N |
| 0 | 12240082 | 0.491694 | 0.00000 | 18.9330 | 12240077 | 0.00000 | 0.491694 | 18.9496 |
| 1 | 12240078 | 0.489854 | 0.00184000 | 18.9066 | 12240080 | -0.00201720 | 0.493711 | 18.9406 |
| 2 | 12240079 | 0.490490 | 0.00120401 | 18.8807 | 12240081 | -0.00219518 | 0.493889 | 18.9316 |