| Red | Green | Blue | |
| z | 17.64 | ||
| znorm | Inf | ||
| sky | -NaN | -NaN | -NaN |
| S/N | 19.3 | 30.8 | 30.8 |
| S/N(c) | 0.0 | 0.0 | 0.0 |
| SN(E/C) |
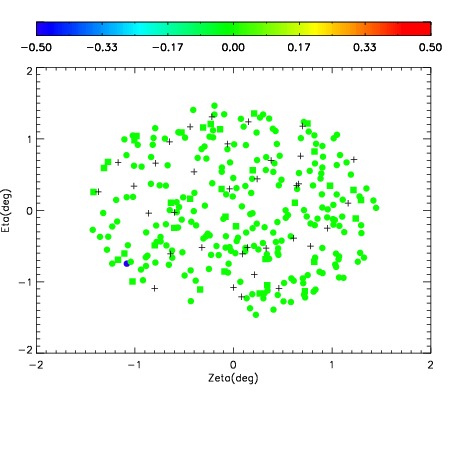
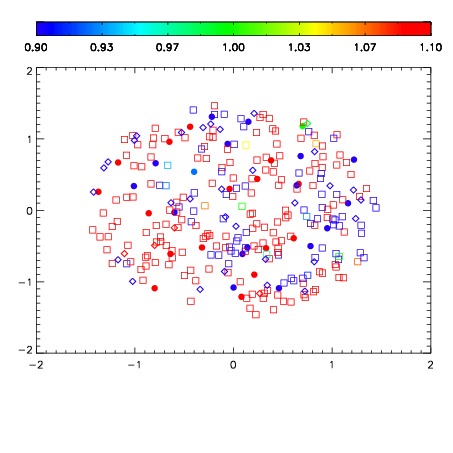
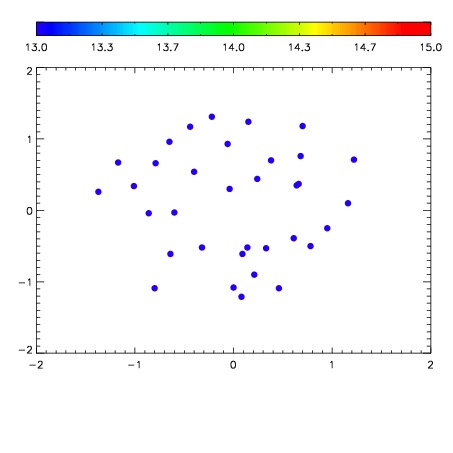

| Frame | Nreads | Zeropoints | Mag plots | Spatial mag deviation | Spatial sky 16325A emission deviations (filled: sky, open: star) | Spatial sky continuum emission | Spatial sky telluric CO2 absorption deviations (filled: H < 10) | |||||||||||||||||||||||
| 0 | 0 |
|
|
|
|
|
|
| IPAIR | NAME | SHIFT | NEWSHIFT | S/N | NAME | SHIFT | NEWSHIFT | S/N |
| 0 | 12300028 | 0.493051 | 0.00000 | 18.3580 | 12300025 | -0.000643824 | 0.493695 | 18.5067 |
| 1 | 12300024 | 0.491408 | 0.00164300 | 18.3932 | 12300029 | -0.00121320 | 0.494264 | 18.5231 |
| 2 | 12300023 | 0.491340 | 0.00171098 | 18.3479 | 12300026 | -0.000812865 | 0.493864 | 18.4243 |
| 3 | 12300027 | 0.492624 | 0.000426978 | 18.2291 | 12300022 | 0.00000 | 0.493051 | 18.3241 |