| Red | Green | Blue | |
| z | 17.64 | ||
| znorm | Inf | ||
| sky | -NaN | -NaN | -Inf |
| S/N | 29.8 | 47.5 | 46.0 |
| S/N(c) | 0.0 | 0.0 | 0.0 |
| SN(E/C) |
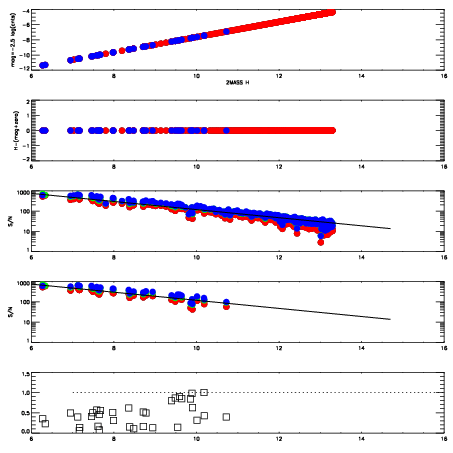
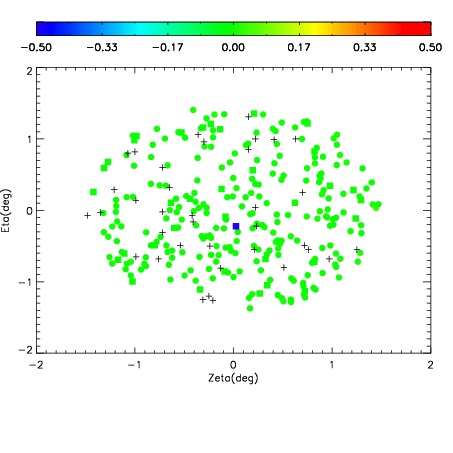
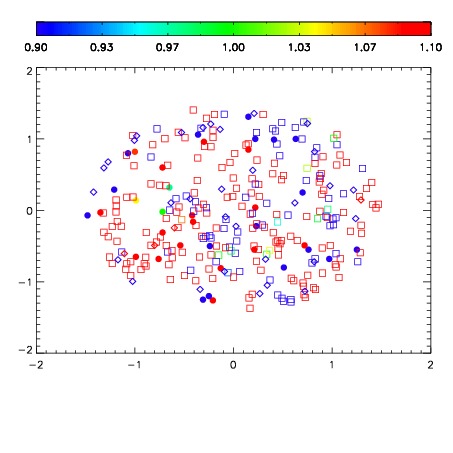
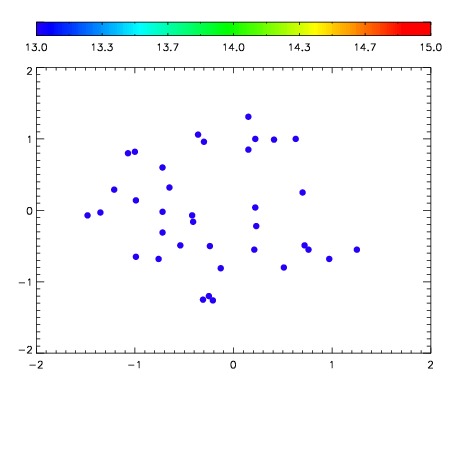

| Frame | Nreads | Zeropoints | Mag plots | Spatial mag deviation | Spatial sky 16325A emission deviations (filled: sky, open: star) | Spatial sky continuum emission | Spatial sky telluric CO2 absorption deviations (filled: H < 10) | |||||||||||||||||||||||
| 0 | 0 |
|
|
|
|
|
|
| IPAIR | NAME | SHIFT | NEWSHIFT | S/N | NAME | SHIFT | NEWSHIFT | S/N |
| 0 | 12190067 | 0.502431 | 0.00000 | 19.1049 | 12190070 | -0.000326508 | 0.502757 | 19.1426 |
| 1 | 12190071 | 0.500623 | 0.00180799 | 19.1686 | 12190073 | -0.00158185 | 0.504013 | 19.1796 |
| 2 | 12190072 | 0.501616 | 0.000814974 | 19.1641 | 12190069 | -0.000865651 | 0.503297 | 19.1564 |
| 3 | 12190068 | 0.502366 | 6.49691e-05 | 19.1027 | 12190066 | 0.00000 | 0.502431 | 19.0919 |