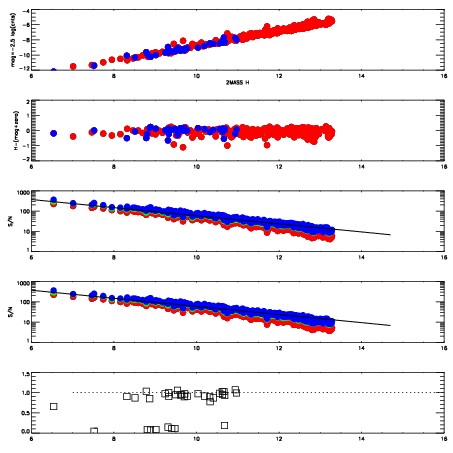
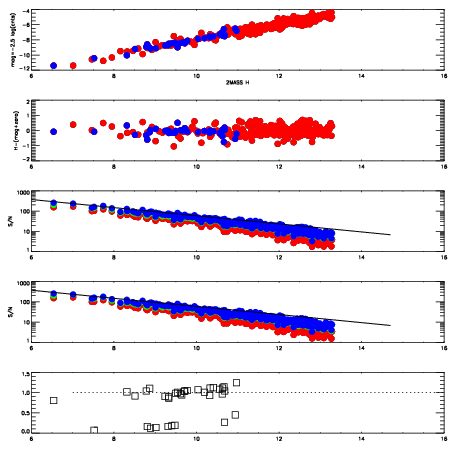
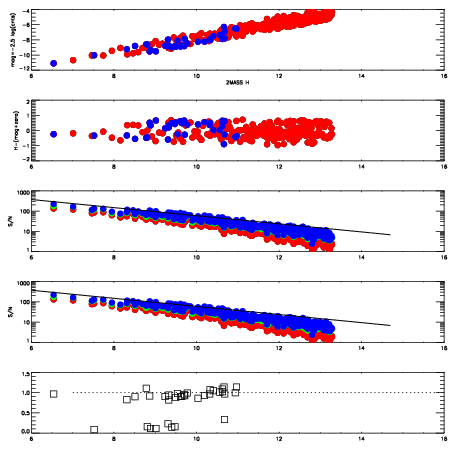
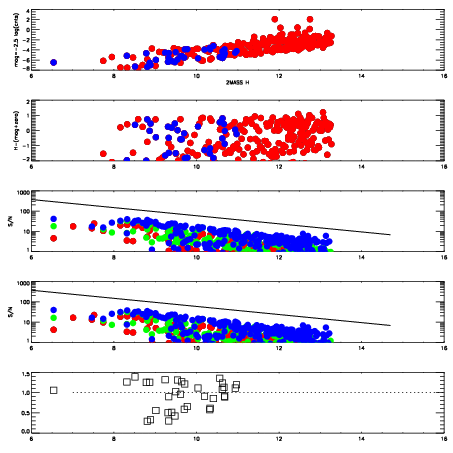
| Frame | Nreads | Zeropoints | Mag plots
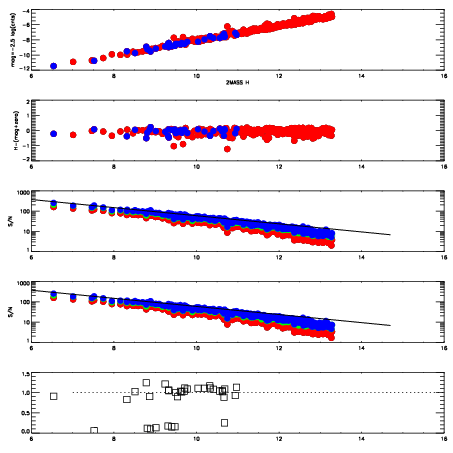
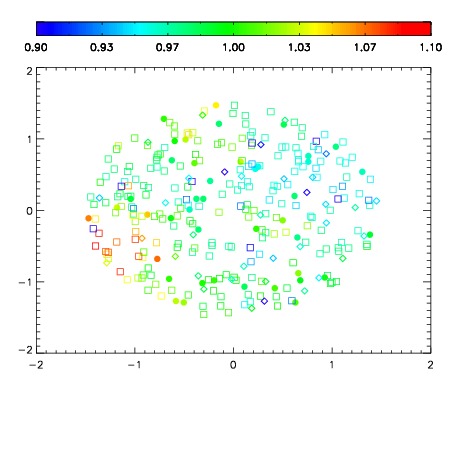
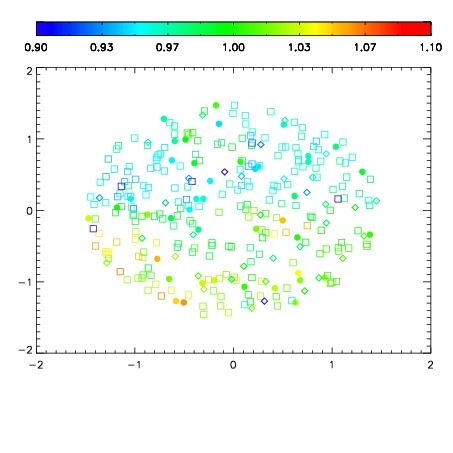
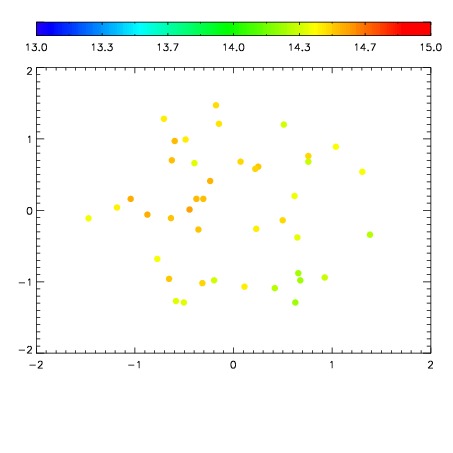
| Spatial mag deviation
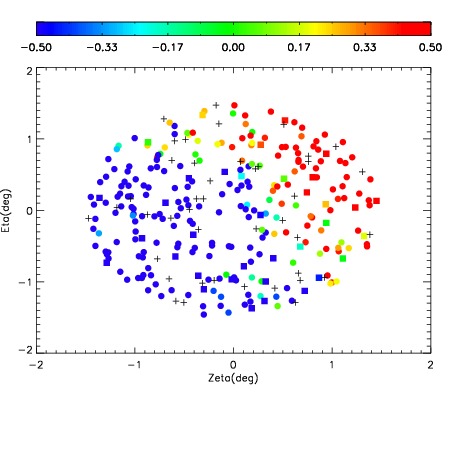
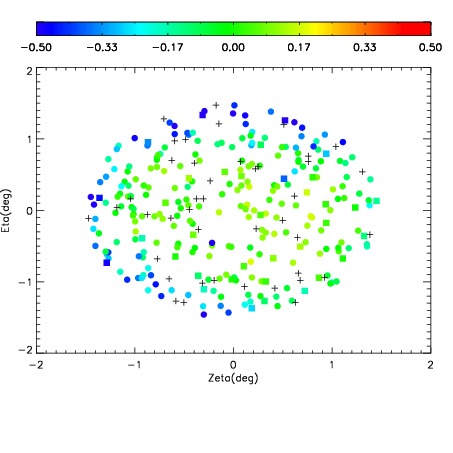
| Spatial sky 16325A emission deviations (filled: sky, open: star)
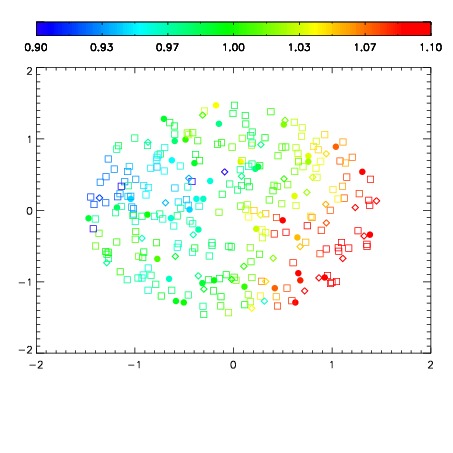
| Spatial sky continuum emission
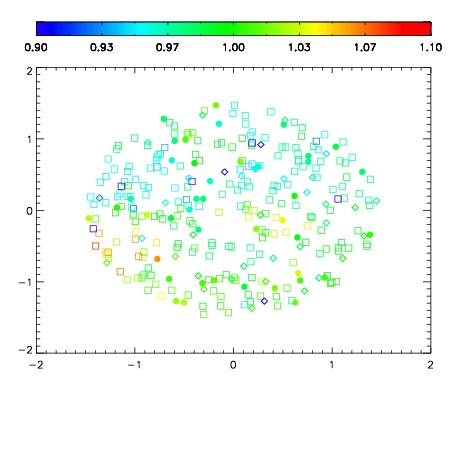
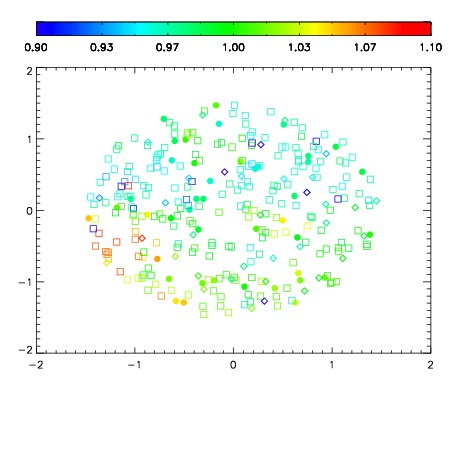
| Spatial sky telluric CO2 absorption deviations (filled: H < 10)
|
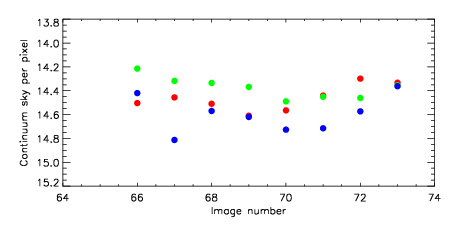
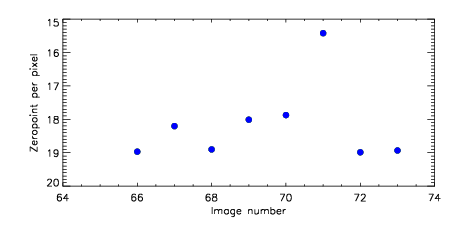
| 5180066
| 47
| | Red | Green | Blue
| | z | | 18.97
| | znorm | | 14.79
| | sky | 14.5 | 14.2 | 14.4
| | S/N | 14.4 | 23.0 | 24.4
| | S/N(c) | 7.5 | 34.8 | 39.4
| | SN(E/C) 0.93
|
| 
| 
| 
| 
| 
|
| 5180067
| 47
| | Red | Green | Blue
| | z | | 18.20
| | znorm | | 14.02
| | sky | 14.5 | 14.3 | 14.8
| | S/N | 8.0 | 14.7 | 16.0
| | S/N(c) | 4.6 | 23.1 | 26.3
| | SN(E/C) 1.02
|
| 
| 
| 
| 
| 
|
| 5180068
| 47
| | Red | Green | Blue
| | z | | 18.90
| | znorm | | 14.72
| | sky | 14.5 | 14.3 | 14.6
| | S/N | 13.9 | 22.5 | 23.9
| | S/N(c) | 7.4 | 34.1 | 38.7
| | SN(E/C) 0.91
|
| 
| 
| 
| 
| 
|
| 5180069
| 47
| | Red | Green | Blue
| | z | | 18.01
| | znorm | | 13.83
| | sky | 14.6 | 14.4 | 14.6
| | S/N | 6.6 | 12.3 | 14.0
| | S/N(c) | 4.2 | 21.0 | 25.3
| | SN(E/C) 0.97
|
| 
| 
| 
| 
| 
|
| 5180070
| 47
| | Red | Green | Blue
| | z | | 17.87
| | znorm | | 13.69
| | sky | 14.6 | 14.5 | 14.7
| | S/N | 5.9 | 11.1 | 12.2
| | S/N(c) | 3.9 | 20.3 | 22.6
| | SN(E/C) 0.92
|
| 
| 
| 
| 
| 
|
| 5180071
| 47
| | Red | Green | Blue
| | z | | 15.42
| | znorm | | 11.24
| | sky | 14.4 | 14.5 | 14.7
| | S/N | 0.4 | 0.9 | 2.8
| | S/N(c) | 0.3 | 2.2 | 3.7
| | SN(E/C) 1.02
|
| 
| 
| 
| 
| 
|
| 5180072
| 47
| | Red | Green | Blue
| | z | | 18.99
| | znorm | | 14.81
| | sky | 14.3 | 14.5 | 14.6
| | S/N | 14.0 | 23.9 | 25.3
| | S/N(c) | 7.7 | 35.2 | 40.2
| | SN(E/C) 0.93
|
| 
| 
| 
| 
| 
|
| 5180073
| 47
| | Red | Green | Blue
| | z | | 18.93
| | znorm | | 14.75
| | sky | 14.3 | 14.4 | 14.4
| | S/N | 13.1 | 22.9 | 23.9
| | S/N(c) | 7.3 | 34.3 | 38.7
| | SN(E/C) 0.95
|
| 
| 
| 
| 
| 
|