| Red | Green | Blue | |
| z | 17.64 | ||
| znorm | Inf | ||
| sky | -Inf | -Inf | -Inf |
| S/N | 18.5 | 33.2 | 35.5 |
| S/N(c) | 0.0 | 0.0 | 0.0 |
| SN(E/C) |

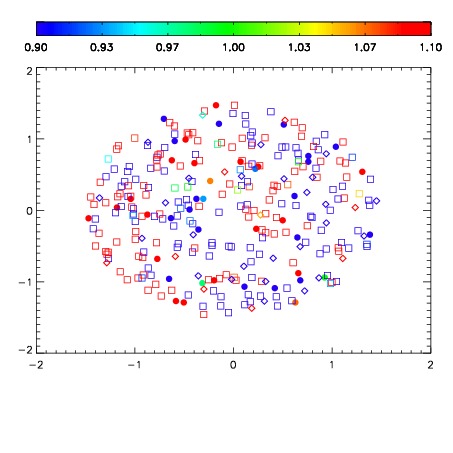


| Frame | Nreads | Zeropoints | Mag plots | Spatial mag deviation | Spatial sky 16325A emission deviations (filled: sky, open: star) | Spatial sky continuum emission | Spatial sky telluric CO2 absorption deviations (filled: H < 10) | |||||||||||||||||||||||
| 0 | 0 |
|
|
|
|
|
|
| IPAIR | NAME | SHIFT | NEWSHIFT | S/N | NAME | SHIFT | NEWSHIFT | S/N |
| 0 | 05180072 | 0.500285 | 0.00000 | 18.9663 | 05180066 | 0.00000 | 0.500285 | 18.9552 |
| 1 | 05180068 | 0.499628 | 0.000657022 | 18.8897 | 05180073 | 0.00425114 | 0.496034 | 18.9122 |
| 2 | 05180067 | 0.495806 | 0.00447902 | 18.1796 | 05180069 | 0.00305809 | 0.497227 | 17.9651 |
| 3 | 05180071 | 0.493355 | 0.00693002 | 14.9275 | 05180070 | 0.000215124 | 0.500070 | 17.8029 |