| Red | Green | Blue | |
| z | 17.64 | ||
| znorm | Inf | ||
| sky | -Inf | -Inf | -Inf |
| S/N | 25.8 | 44.7 | 46.1 |
| S/N(c) | 0.0 | 0.0 | 0.0 |
| SN(E/C) |

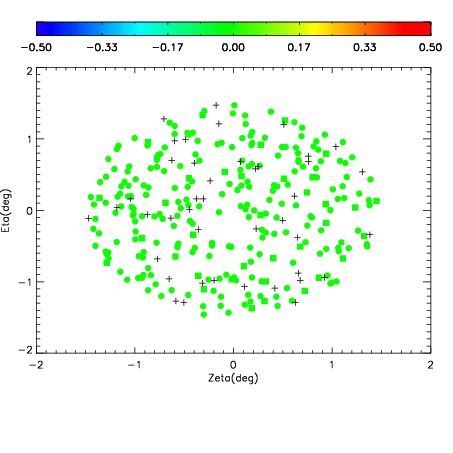
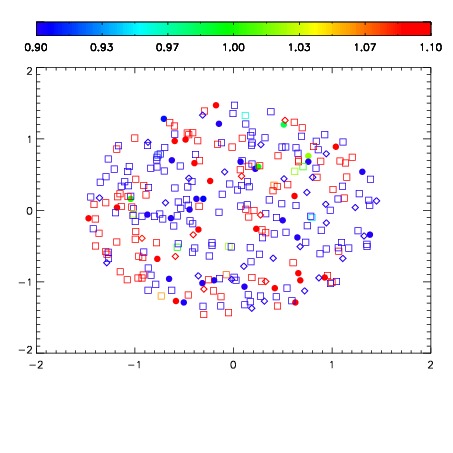
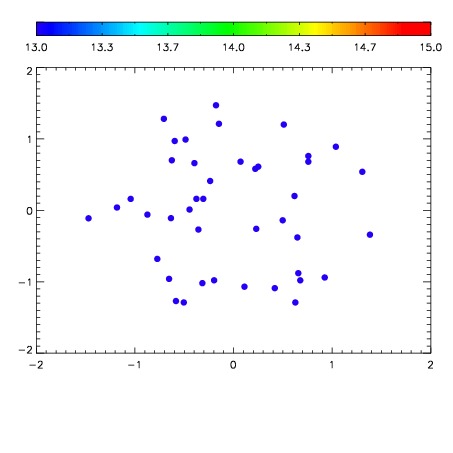

| Frame | Nreads | Zeropoints | Mag plots | Spatial mag deviation | Spatial sky 16325A emission deviations (filled: sky, open: star) | Spatial sky continuum emission | Spatial sky telluric CO2 absorption deviations (filled: H < 10) | |||||||||||||||||||||||
| 0 | 0 |
|
|
|
|
|
|
| IPAIR | NAME | SHIFT | NEWSHIFT | S/N | NAME | SHIFT | NEWSHIFT | S/N |
| 0 | 05250038 | 0.484616 | 0.00000 | 19.1185 | 05250040 | -0.00215349 | 0.486769 | 19.1036 |
| 1 | 05250043 | 0.484481 | 0.000135005 | 19.1095 | 05250044 | -0.00221524 | 0.486831 | 19.0996 |
| 2 | 05250039 | 0.484492 | 0.000124007 | 19.0760 | 05250037 | 0.00000 | 0.484616 | 19.0973 |
| 3 | 05250042 | 0.484000 | 0.000616014 | 19.0755 | 05250041 | -0.00466765 | 0.489284 | 19.0756 |