| Red | Green | Blue | |
| z | 17.64 | ||
| znorm | Inf | ||
| sky | -Inf | -NaN | -Inf |
| S/N | 17.3 | 30.3 | 32.7 |
| S/N(c) | 0.0 | 0.0 | 0.0 |
| SN(E/C) |

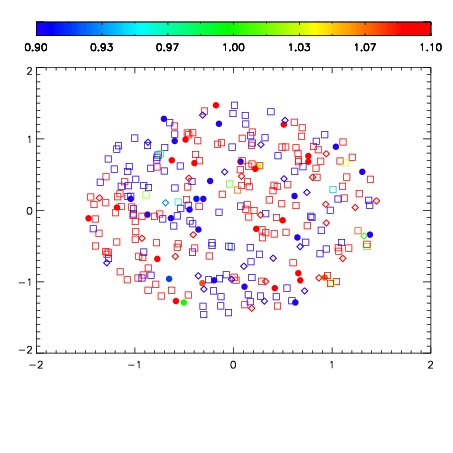
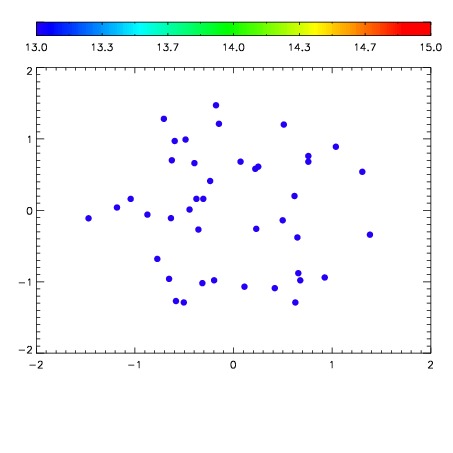

| Frame | Nreads | Zeropoints | Mag plots | Spatial mag deviation | Spatial sky 16325A emission deviations (filled: sky, open: star) | Spatial sky continuum emission | Spatial sky telluric CO2 absorption deviations (filled: H < 10) | |||||||||||||||||||||||
| 0 | 0 |
|
|
|
|
|
|
| IPAIR | NAME | SHIFT | NEWSHIFT | S/N | NAME | SHIFT | NEWSHIFT | S/N |
| 0 | 06420013 | 0.479124 | 0.00000 | 18.5620 | 06420011 | 0.00000 | 0.479124 | 18.1721 |
| 1 | 06420017 | 0.478536 | 0.000588000 | 18.8870 | 06420018 | -0.00366656 | 0.482791 | 18.9482 |
| 2 | 06420016 | 0.478225 | 0.000899017 | 18.5694 | 06420015 | -0.00379888 | 0.482923 | 18.2116 |
| 3 | 06420012 | 0.478858 | 0.000266016 | 18.4573 | 06420014 | -0.000330085 | 0.479454 | 18.1025 |