| Red | Green | Blue | |
| z | 17.64 | ||
| znorm | Inf | ||
| sky | -Inf | -Inf | -NaN |
| S/N | 26.4 | 46.2 | 48.8 |
| S/N(c) | 0.0 | 0.0 | 0.0 |
| SN(E/C) |
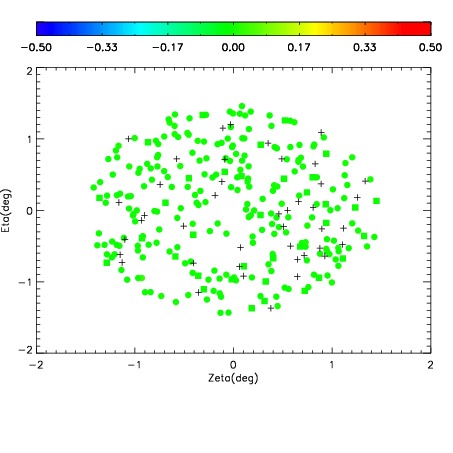
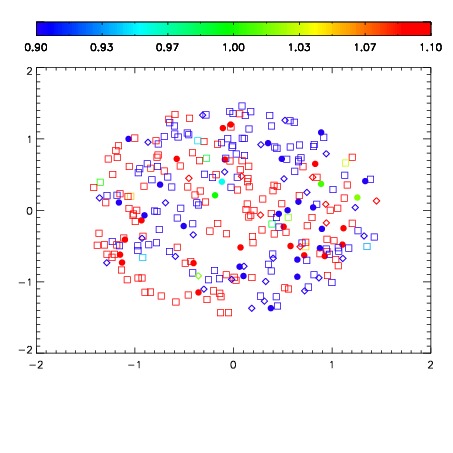
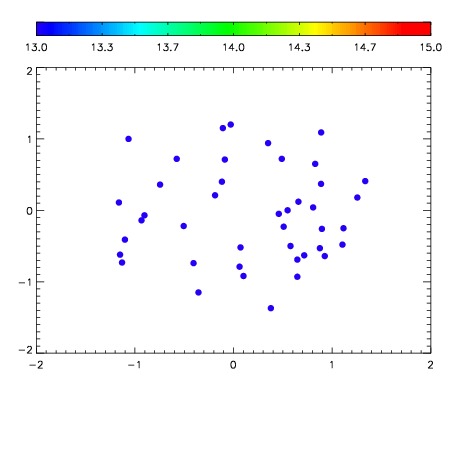

| Frame | Nreads | Zeropoints | Mag plots | Spatial mag deviation | Spatial sky 16325A emission deviations (filled: sky, open: star) | Spatial sky continuum emission | Spatial sky telluric CO2 absorption deviations (filled: H < 10) | |||||||||||||||||||||||
| 0 | 0 |
|
|
|
|
|
|
| IPAIR | NAME | SHIFT | NEWSHIFT | S/N | NAME | SHIFT | NEWSHIFT | S/N |
| 0 | 08750035 | 0.484547 | 0.00000 | 18.9379 | 08750037 | 0.00287411 | 0.481673 | 18.9692 |
| 1 | 08750039 | 0.482167 | 0.00237998 | 18.9247 | 08750036 | 0.00348064 | 0.481066 | 18.9544 |
| 2 | 08750038 | 0.482453 | 0.00209400 | 18.9076 | 08750040 | 0.000285924 | 0.484261 | 18.8522 |
| 3 | 08750042 | 0.482978 | 0.00156900 | 18.8899 | 08750041 | -2.13146e-05 | 0.484568 | 18.8295 |
| 4 | 08750034 | 0.483746 | 0.000800997 | 18.7417 | 08750033 | 0.00000 | 0.484547 | 18.4349 |