| Red | Green | Blue | |
| z | 17.64 | ||
| znorm | Inf | ||
| sky | -Inf | -Inf | -Inf |
| S/N | 27.9 | 45.8 | 50.4 |
| S/N(c) | 0.0 | 0.0 | 0.0 |
| SN(E/C) |
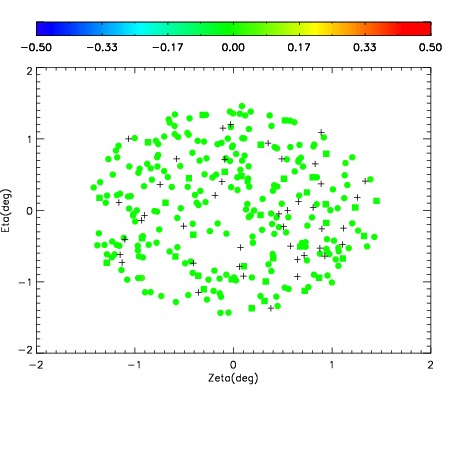
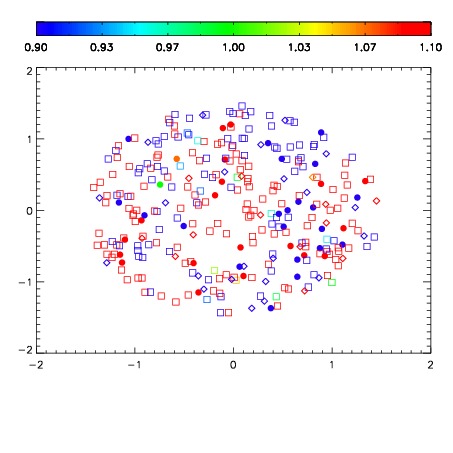
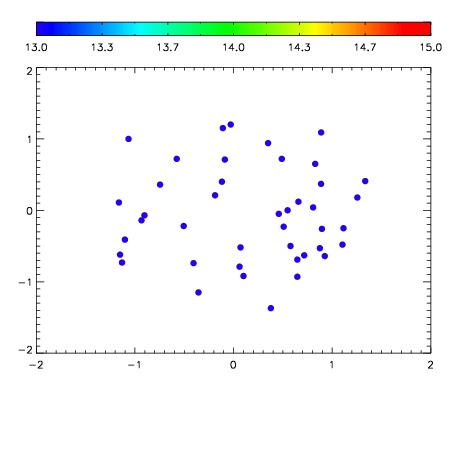

| Frame | Nreads | Zeropoints | Mag plots | Spatial mag deviation | Spatial sky 16325A emission deviations (filled: sky, open: star) | Spatial sky continuum emission | Spatial sky telluric CO2 absorption deviations (filled: H < 10) | |||||||||||||||||||||||
| 0 | 0 |
|
|
|
|
|
|
| IPAIR | NAME | SHIFT | NEWSHIFT | S/N | NAME | SHIFT | NEWSHIFT | S/N |
| 0 | 08820032 | 0.481244 | 0.00000 | 19.0406 | 08820029 | 0.00243117 | 0.478813 | 19.0288 |
| 1 | 08820028 | 0.479777 | 0.00146699 | 19.0595 | 08820033 | 0.00243671 | 0.478807 | 19.0682 |
| 2 | 08820031 | 0.480859 | 0.000384986 | 19.0207 | 08820030 | 0.00231336 | 0.478931 | 18.9861 |
| 3 | 08820027 | 0.479810 | 0.00143400 | 19.0104 | 08820026 | 0.00000 | 0.481244 | 18.9324 |