| Red | Green | Blue | |
| z | 17.64 | ||
| znorm | Inf | ||
| sky | -Inf | -Inf | -NaN |
| S/N | 22.9 | 39.0 | 42.5 |
| S/N(c) | 0.0 | 0.0 | 0.0 |
| SN(E/C) |
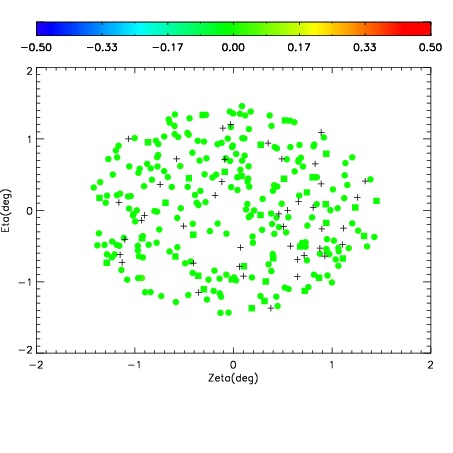

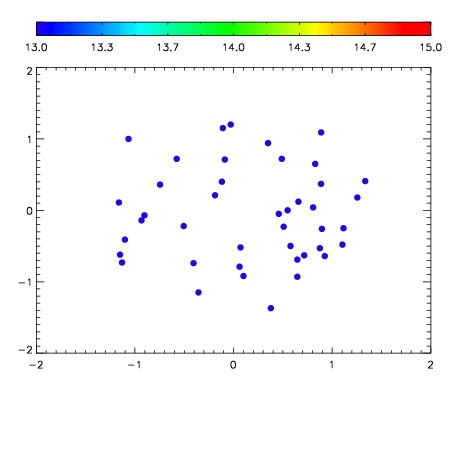

| Frame | Nreads | Zeropoints | Mag plots | Spatial mag deviation | Spatial sky 16325A emission deviations (filled: sky, open: star) | Spatial sky continuum emission | Spatial sky telluric CO2 absorption deviations (filled: H < 10) | |||||||||||||||||||||||
| 0 | 0 |
|
|
|
|
|
|
| IPAIR | NAME | SHIFT | NEWSHIFT | S/N | NAME | SHIFT | NEWSHIFT | S/N |
| 0 | 09090028 | 0.485061 | 0.00000 | 18.9202 | 09090022 | 0.00000 | 0.485061 | 18.8651 |
| 1 | 09090027 | 0.484909 | 0.000151992 | 18.8036 | 09090026 | 0.00524671 | 0.479814 | 18.7865 |
| 2 | 09090023 | 0.483734 | 0.00132698 | 18.7722 | 09090029 | 0.00509726 | 0.479964 | 18.7737 |
| 3 | 09090024 | 0.483523 | 0.00153798 | 18.7445 | 09090025 | 0.00428516 | 0.480776 | 18.4039 |