| Red | Green | Blue | |
| z | 17.64 | ||
| znorm | Inf | ||
| sky | -NaN | -NaN | -NaN |
| S/N | 25.8 | 44.8 | 47.0 |
| S/N(c) | 0.0 | 0.0 | 0.0 |
| SN(E/C) |
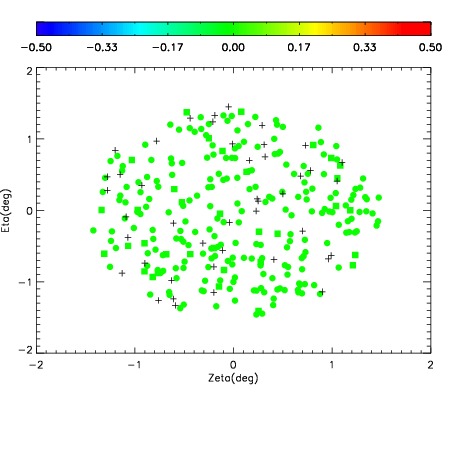
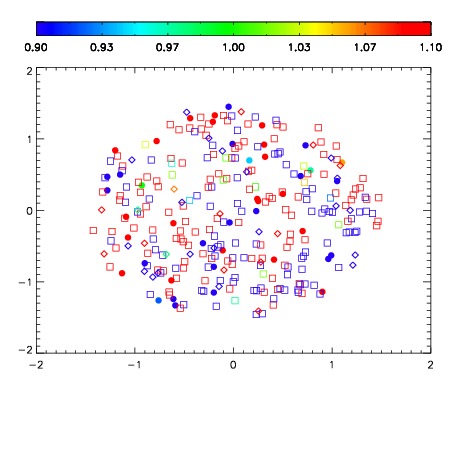
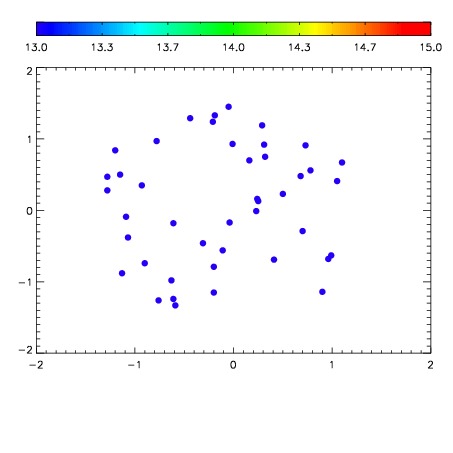

| Frame | Nreads | Zeropoints | Mag plots | Spatial mag deviation | Spatial sky 16325A emission deviations (filled: sky, open: star) | Spatial sky continuum emission | Spatial sky telluric CO2 absorption deviations (filled: H < 10) | |||||||||||||||||||||||
| 0 | 0 |
|
|
|
|
|
|
| IPAIR | NAME | SHIFT | NEWSHIFT | S/N | NAME | SHIFT | NEWSHIFT | S/N |
| 0 | 12170028 | 0.495231 | 0.00000 | 18.9614 | 12170029 | -0.00395583 | 0.499187 | 18.9836 |
| 1 | 12170024 | 0.493860 | 0.00137100 | 18.8849 | 12170026 | -0.00344336 | 0.498674 | 18.9402 |
| 2 | 12170027 | 0.494233 | 0.000997990 | 18.8810 | 12170025 | -0.00352174 | 0.498753 | 18.9067 |
| 3 | 12170023 | 0.493289 | 0.00194201 | 18.8481 | 12170022 | 0.00000 | 0.495231 | 18.8212 |