| Red | Green | Blue | |
| z | 17.64 | ||
| znorm | Inf | ||
| sky | -NaN | -NaN | -NaN |
| S/N | 26.5 | 45.4 | 49.0 |
| S/N(c) | 0.0 | 0.0 | 0.0 |
| SN(E/C) |
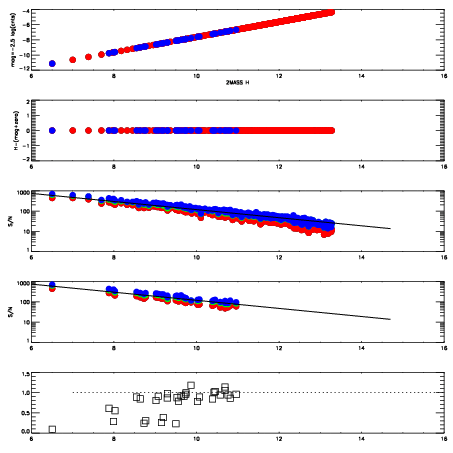
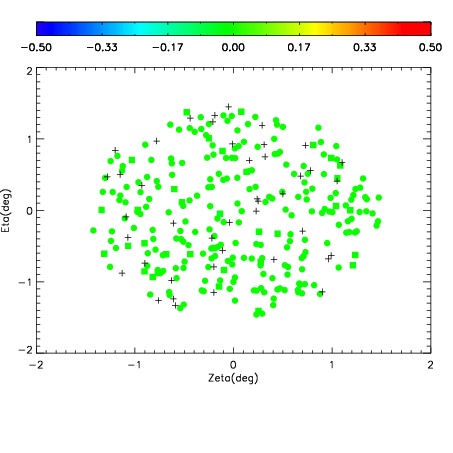
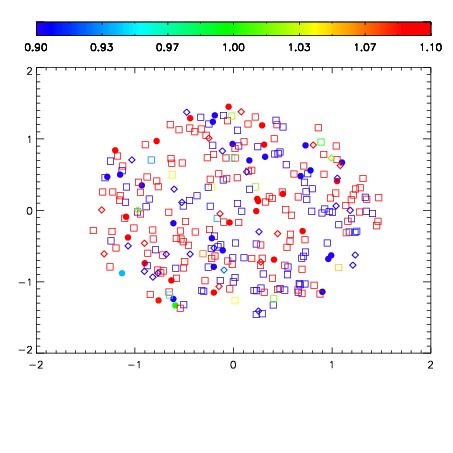
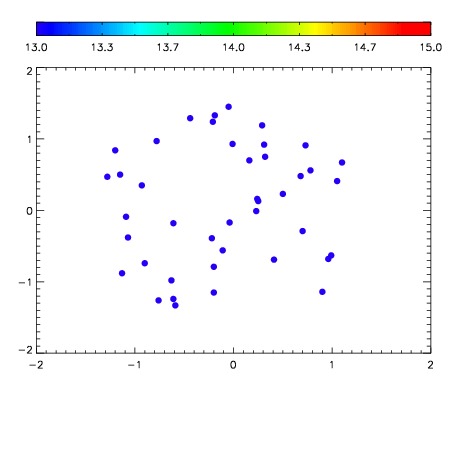

| Frame | Nreads | Zeropoints | Mag plots | Spatial mag deviation | Spatial sky 16325A emission deviations (filled: sky, open: star) | Spatial sky continuum emission | Spatial sky telluric CO2 absorption deviations (filled: H < 10) | |||||||||||||||||||||||
| 0 | 0 |
|
|
|
|
|
|
| IPAIR | NAME | SHIFT | NEWSHIFT | S/N | NAME | SHIFT | NEWSHIFT | S/N |
| 0 | 12210028 | 0.512623 | 0.00000 | 18.8704 | 12210026 | 0.00000 | 0.512623 | 18.6932 |
| 1 | 12210032 | 0.509590 | 0.00303298 | 18.9869 | 12210033 | -0.00200640 | 0.514629 | 19.0302 |
| 2 | 12210031 | 0.509507 | 0.00311601 | 18.9750 | 12210029 | 0.000206561 | 0.512416 | 18.9739 |
| 3 | 12210027 | 0.512105 | 0.000518024 | 18.9127 | 12210030 | 0.000410698 | 0.512212 | 18.9686 |