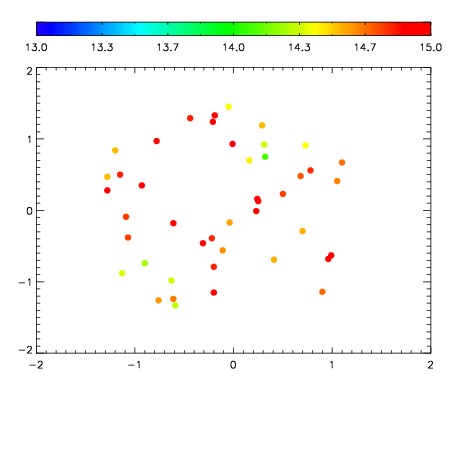
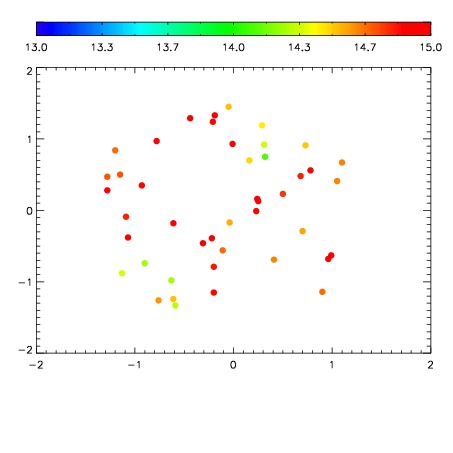
| Frame | Nreads | Zeropoints | Mag plots
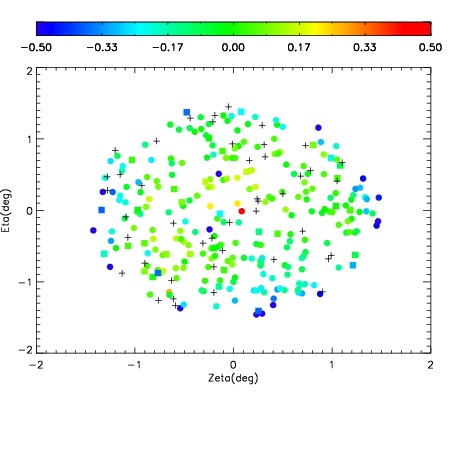
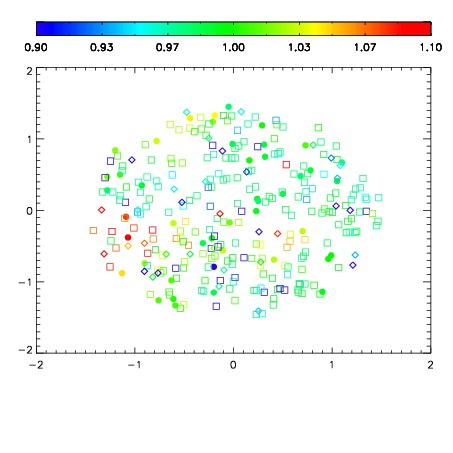
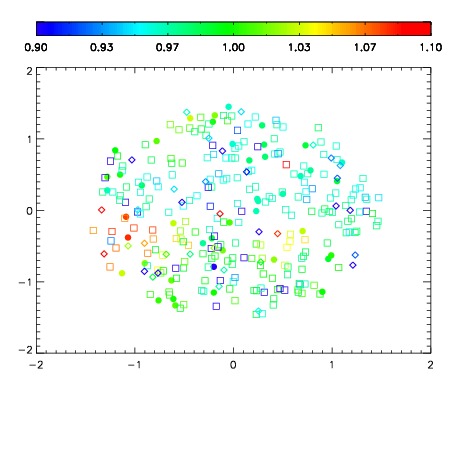
| Spatial mag deviation
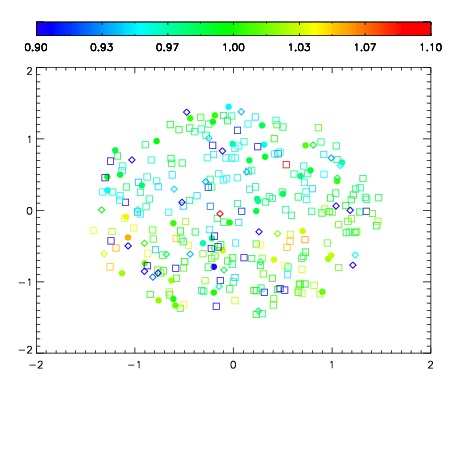
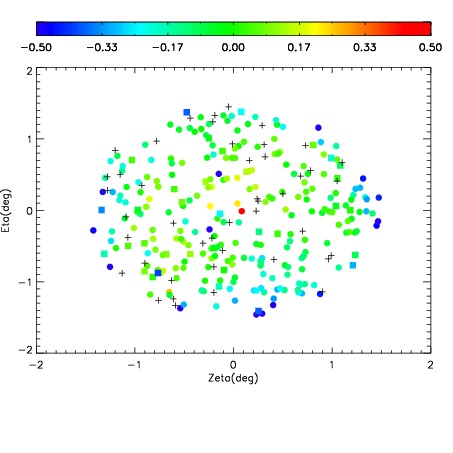
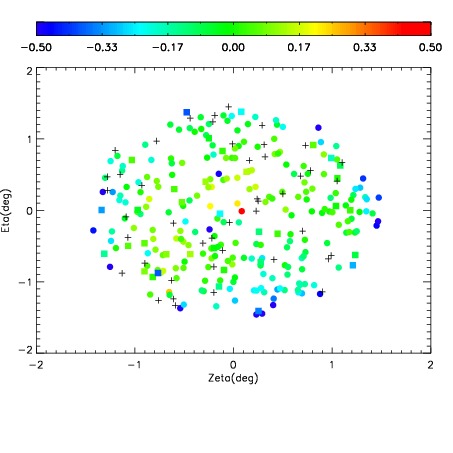
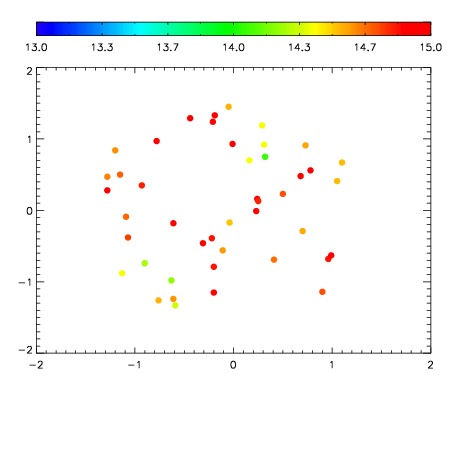
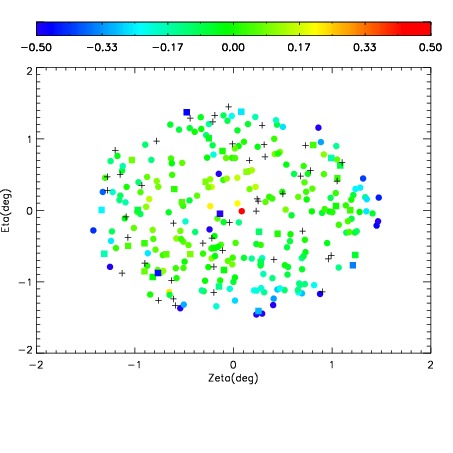
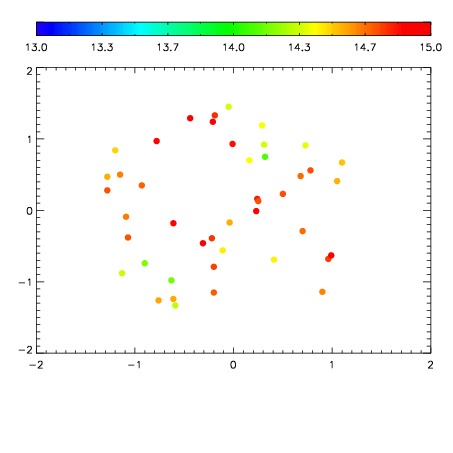
| Spatial sky 16325A emission deviations (filled: sky, open: star)
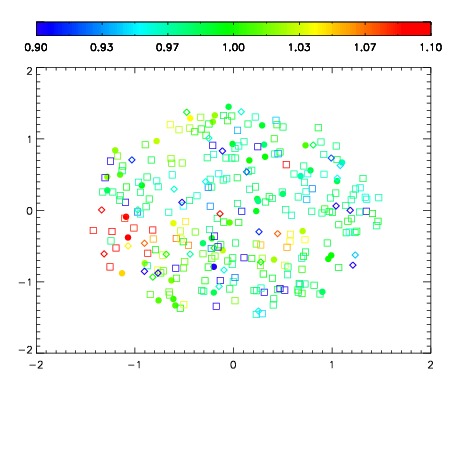
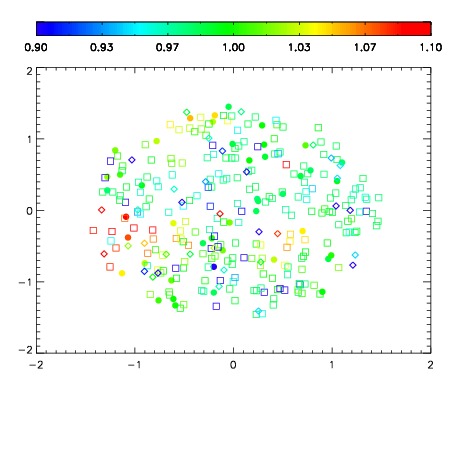
| Spatial sky continuum emission
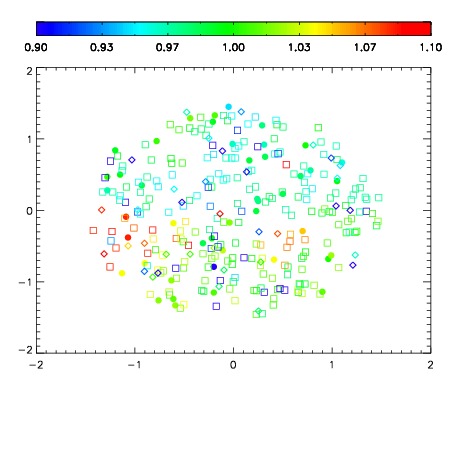
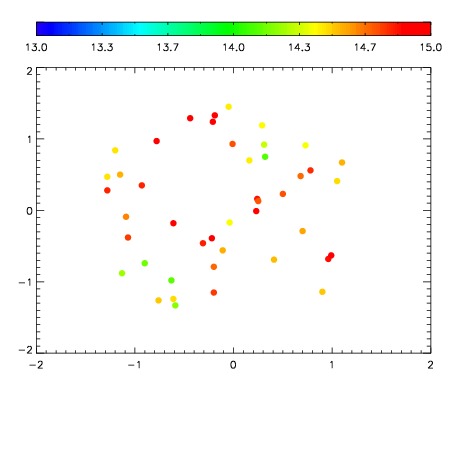
| Spatial sky telluric CO2 absorption deviations (filled: H < 10)
|
| 12250070
| 47
| | Red | Green | Blue
| | z | | 19.06
| | znorm | | 14.88
| | sky | 14.8 | 14.7 | 14.5
| | S/N | 16.1 | 26.3 | 27.7
| | S/N(c) | 4.5 | 31.6 | 39.1
| | SN(E/C) 0.81
|
| 
| 
| 
| 
| 
|
| 12250071
| 47
| | Red | Green | Blue
| | z | | 19.08
| | znorm | | 14.90
| | sky | 14.8 | 14.6 | 14.8
| | S/N | 16.3 | 26.4 | 28.3
| | S/N(c) | 4.5 | 31.7 | 39.7
| | SN(E/C) 0.79
|
| 
| 
| 
| 
| 
|
| 12250072
| 47
| | Red | Green | Blue
| | z | | 19.08
| | znorm | | 14.90
| | sky | 14.7 | 14.7 | 14.8
| | S/N | 16.3 | 26.8 | 28.2
| | S/N(c) | 4.5 | 31.6 | 40.6
| | SN(E/C) 0.77
|
| 
| 
| 
| 
| 
|
| 12250073
| 47
| | Red | Green | Blue
| | z | | 19.08
| | znorm | | 14.90
| | sky | 15.2 | 14.8 | 15.0
| | S/N | 16.0 | 26.5 | 28.3
| | S/N(c) | 4.4 | 31.5 | 40.9
| | SN(E/C) 0.81
|
| 
| 
| 
| 
| 
|
| 12250074
| 47
| | Red | Green | Blue
| | z | | 19.17
| | znorm | | 14.99
| | sky | 14.8 | 14.7 | 14.8
| | S/N | 17.0 | 27.8 | 29.6
| | S/N(c) | 4.6 | 33.1 | 42.5
| | SN(E/C) 0.76
|
| 
| 
| 
| 
| 
|
| 12250075
| 47
| | Red | Green | Blue
| | z | | 19.15
| | znorm | | 14.97
| | sky | 14.6 | 14.6 | 14.7
| | S/N | 16.7 | 27.3 | 29.2
| | S/N(c) | 4.6 | 32.9 | 42.3
| | SN(E/C) 0.80
|
| 
| 
| 
| 
| 
|
| 12250076
| 47
| | Red | Green | Blue
| | z | | 19.17
| | znorm | | 14.99
| | sky | 14.7 | 14.7 | 14.9
| | S/N | 17.1 | 27.7 | 29.6
| | S/N(c) | 4.6 | 32.9 | 42.7
| | SN(E/C) 0.82
|
| 
| 
| 
| 
| 
|
| 12250077
| 47
| | Red | Green | Blue
| | z | | 19.17
| | znorm | | 14.99
| | sky | 14.8 | 14.7 | 14.8
| | S/N | 17.0 | 27.7 | 29.2
| | S/N(c) | 4.6 | 32.9 | 42.9
| | SN(E/C) 0.78
|
| 
| 
| 
| 
| 
|