| Red | Green | Blue | |
| z | 17.64 | ||
| znorm | Inf | ||
| sky | -Inf | -Inf | -NaN |
| S/N | 15.0 | 29.1 | 30.4 |
| S/N(c) | 0.0 | 0.0 | 0.0 |
| SN(E/C) |
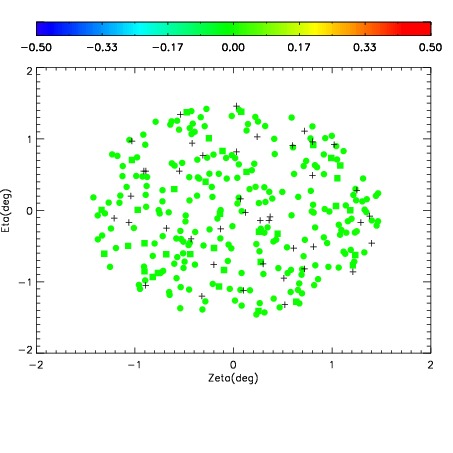
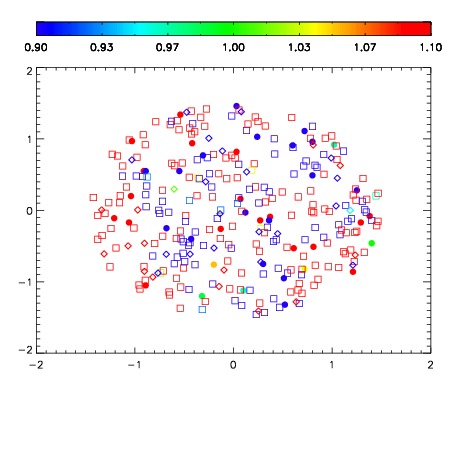


| Frame | Nreads | Zeropoints | Mag plots | Spatial mag deviation | Spatial sky 16325A emission deviations (filled: sky, open: star) | Spatial sky continuum emission | Spatial sky telluric CO2 absorption deviations (filled: H < 10) | |||||||||||||||||||||||
| 0 | 0 |
|
|
|
|
|
|
| IPAIR | NAME | SHIFT | NEWSHIFT | S/N | NAME | SHIFT | NEWSHIFT | S/N |
| 0 | 12130032 | 0.496735 | 0.00000 | 18.1947 | 12130033 | 0.000659120 | 0.496076 | 18.3879 |
| 1 | 12130027 | 0.494241 | 0.00249401 | 18.4820 | 12130029 | -0.000279517 | 0.497015 | 18.5365 |
| 2 | 12130028 | 0.494393 | 0.00234202 | 18.3885 | 12130026 | 0.00000 | 0.496735 | 18.5218 |
| 3 | 12130031 | 0.496396 | 0.000339001 | 18.3296 | 12130030 | 0.000763033 | 0.495972 | 18.4244 |