| Red | Green | Blue | |
| z | 17.64 | ||
| znorm | Inf | ||
| sky | -Inf | -NaN | -NaN |
| S/N | 24.8 | 43.8 | 44.7 |
| S/N(c) | 0.0 | 0.0 | 0.0 |
| SN(E/C) |
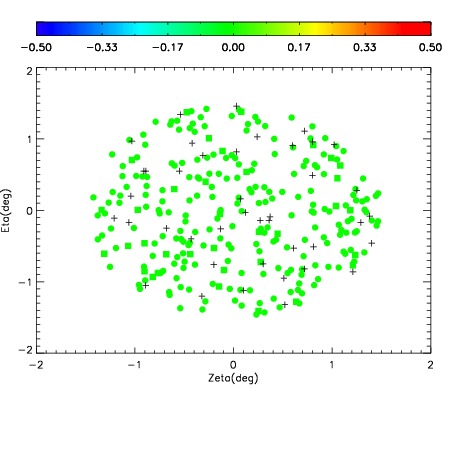
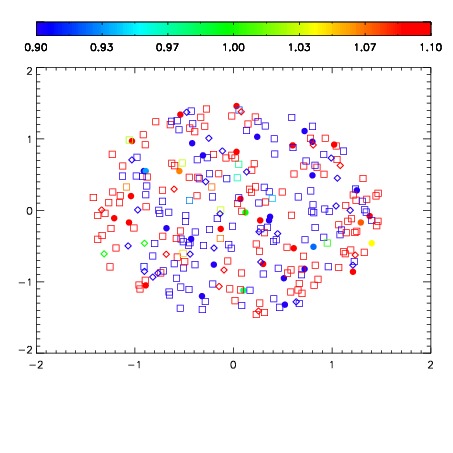
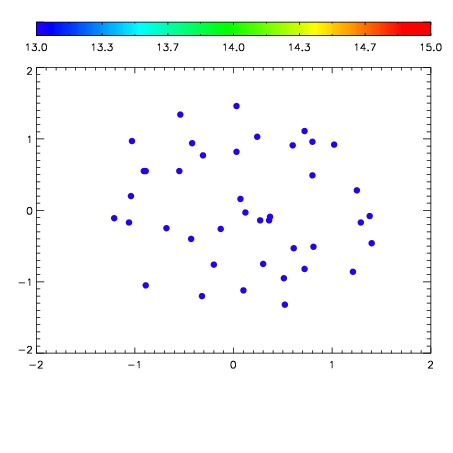

| Frame | Nreads | Zeropoints | Mag plots | Spatial mag deviation | Spatial sky 16325A emission deviations (filled: sky, open: star) | Spatial sky continuum emission | Spatial sky telluric CO2 absorption deviations (filled: H < 10) | |||||||||||||||||||||||
| 0 | 0 |
|
|
|
|
|
|
| IPAIR | NAME | SHIFT | NEWSHIFT | S/N | NAME | SHIFT | NEWSHIFT | S/N |
| 0 | 12190056 | 0.501329 | 0.00000 | 19.0045 | 12190055 | 0.00000 | 0.501329 | 18.9476 |
| 1 | 12190060 | 0.500694 | 0.000635028 | 19.0897 | 12190062 | -0.00308481 | 0.504414 | 19.1206 |
| 2 | 12190061 | 0.501028 | 0.000301003 | 19.0788 | 12190058 | -0.00112540 | 0.502454 | 19.0657 |
| 3 | 12190057 | 0.500553 | 0.000775993 | 19.0273 | 12190059 | -0.00105813 | 0.502387 | 19.0642 |