| Red | Green | Blue | |
| z | 17.64 | ||
| znorm | Inf | ||
| sky | -NaN | -NaN | -Inf |
| S/N | 22.6 | 39.0 | 42.2 |
| S/N(c) | 0.0 | 0.0 | 0.0 |
| SN(E/C) |
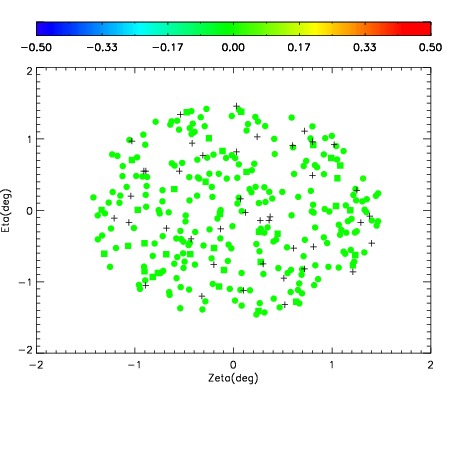
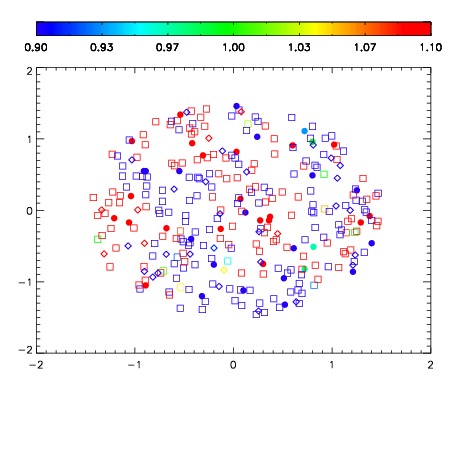
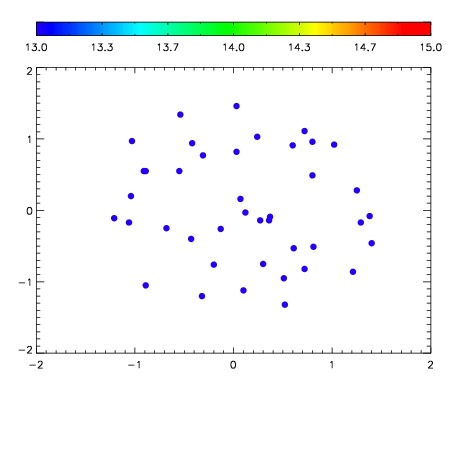

| Frame | Nreads | Zeropoints | Mag plots | Spatial mag deviation | Spatial sky 16325A emission deviations (filled: sky, open: star) | Spatial sky continuum emission | Spatial sky telluric CO2 absorption deviations (filled: H < 10) | |||||||||||||||||||||||
| 0 | 0 |
|
|
|
|
|
|
| IPAIR | NAME | SHIFT | NEWSHIFT | S/N | NAME | SHIFT | NEWSHIFT | S/N |
| 0 | 12310067 | 0.491741 | 0.00000 | 19.0245 | 12310066 | 0.00000 | 0.491741 | 18.9439 |
| 1 | 12310071 | 0.490429 | 0.00131199 | 19.1026 | 12310069 | 1.43265e-05 | 0.491727 | 19.1484 |
| 2 | 12310068 | 0.491696 | 4.50015e-05 | 19.0899 | 12310070 | 0.000543702 | 0.491197 | 19.1462 |
| 3 | 12310072 | 0.490667 | 0.00107402 | 19.0269 | 12310073 | -0.00310006 | 0.494841 | 18.9497 |