| Red | Green | Blue | |
| z | 17.64 | ||
| znorm | Inf | ||
| sky | -Inf | -Inf | -NaN |
| S/N | 24.6 | 42.5 | 43.4 |
| S/N(c) | 0.0 | 0.0 | 0.0 |
| SN(E/C) |
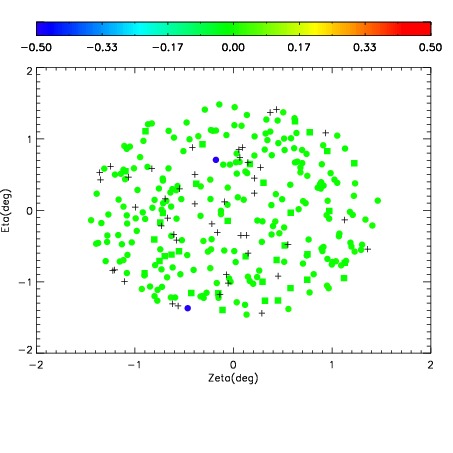
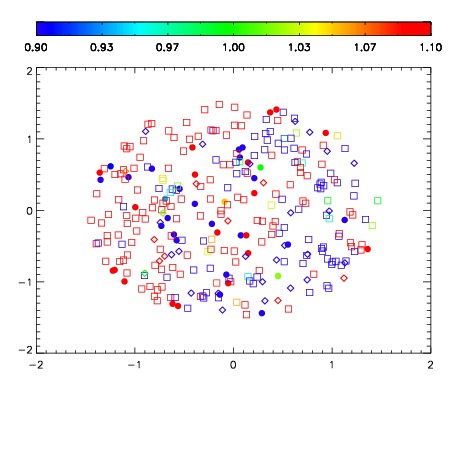


| Frame | Nreads | Zeropoints | Mag plots | Spatial mag deviation | Spatial sky 16325A emission deviations (filled: sky, open: star) | Spatial sky continuum emission | Spatial sky telluric CO2 absorption deviations (filled: H < 10) | |||||||||||||||||||||||
| 0 | 0 |
|
|
|
|
|
|
| IPAIR | NAME | SHIFT | NEWSHIFT | S/N | NAME | SHIFT | NEWSHIFT | S/N |
| 0 | 02600013 | 0.420954 | 0.00000 | 18.8540 | 02600018 | 0.00482282 | 0.416131 | 18.8592 |
| 1 | 02600016 | 0.419490 | 0.00146398 | 18.9825 | 02600015 | -0.00113025 | 0.422084 | 18.9422 |
| 2 | 02600017 | 0.419172 | 0.00178200 | 18.9077 | 02600014 | 0.00282571 | 0.418128 | 18.8960 |
| 3 | 02600012 | 0.419956 | 0.000997990 | 18.8351 | 02600011 | 0.00000 | 0.420954 | 18.8385 |