| Red | Green | Blue | |
| z | 17.64 | ||
| znorm | Inf | ||
| sky | -Inf | -Inf | -Inf |
| S/N | 26.0 | 42.9 | 41.3 |
| S/N(c) | 0.0 | 0.0 | 0.0 |
| SN(E/C) |
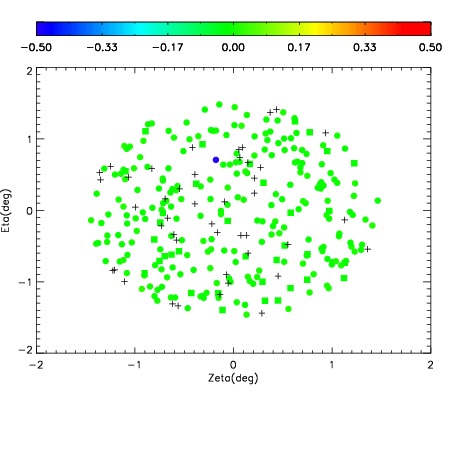
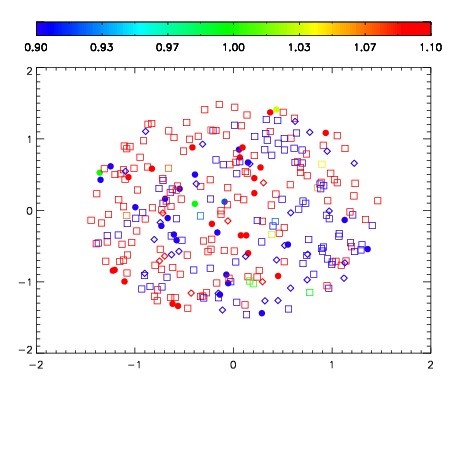
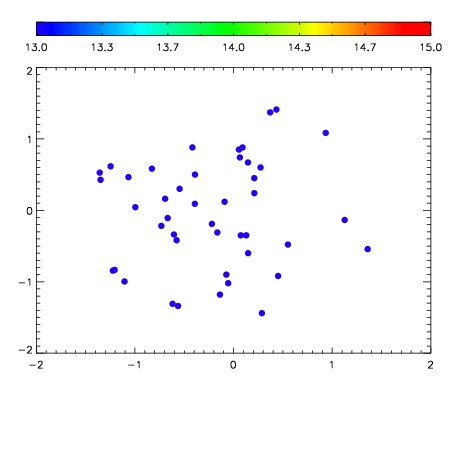

| Frame | Nreads | Zeropoints | Mag plots | Spatial mag deviation | Spatial sky 16325A emission deviations (filled: sky, open: star) | Spatial sky continuum emission | Spatial sky telluric CO2 absorption deviations (filled: H < 10) | |||||||||||||||||||||||
| 0 | 0 |
|
|
|
|
|
|
| IPAIR | NAME | SHIFT | NEWSHIFT | S/N | NAME | SHIFT | NEWSHIFT | S/N |
| 0 | 04890086 | 0.486673 | 0.00000 | 19.1048 | 04890087 | 0.000533386 | 0.486140 | 19.0991 |
| 1 | 04890085 | 0.485165 | 0.00150800 | 19.0881 | 04890088 | -0.000906114 | 0.487579 | 19.0858 |
| 2 | 04890089 | 0.484676 | 0.00199699 | 19.0832 | 04890084 | 0.00000 | 0.486673 | 18.9734 |