| Red | Green | Blue | |
| z | 17.63 | ||
| znorm | Inf | ||
| sky | -Inf | -NaN | -Inf |
| S/N | 24.6 | 41.5 | 46.1 |
| S/N(c) | 0.0 | 0.0 | 0.0 |
| SN(E/C) |
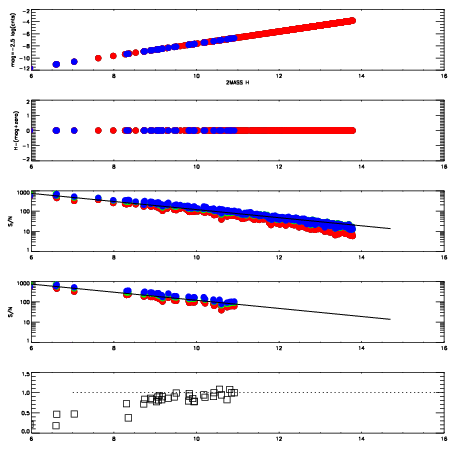


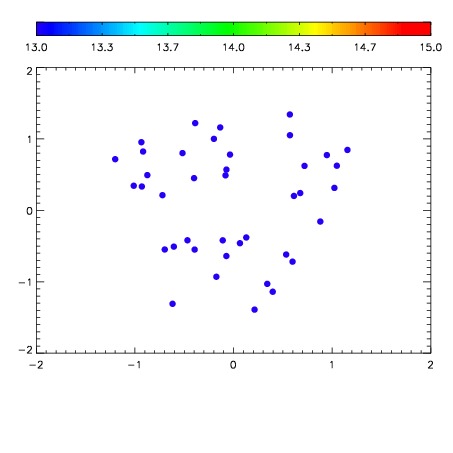

| Frame | Nreads | Zeropoints | Mag plots | Spatial mag deviation | Spatial sky 16325A emission deviations (filled: sky, open: star) | Spatial sky continuum emission | Spatial sky telluric CO2 absorption deviations (filled: H < 10) | |||||||||||||||||||||||
| 0 | 0 |
|
|
|
|
|
|
| IPAIR | NAME | SHIFT | NEWSHIFT | S/N | NAME | SHIFT | NEWSHIFT | S/N |
| 0 | 05170030 | 0.495846 | 0.00000 | 19.0595 | 05170031 | 0.00370512 | 0.492141 | 19.0723 |
| 1 | 05170029 | 0.494099 | 0.00174701 | 19.0374 | 05170024 | 0.00000 | 0.495846 | 19.0069 |
| 2 | 05170025 | 0.494838 | 0.00100800 | 19.0301 | 05170028 | 0.00127744 | 0.494569 | 18.9713 |
| 3 | 05170026 | 0.494145 | 0.00170100 | 18.9657 | 05170027 | 0.00273826 | 0.493108 | 18.9589 |