| Red | Green | Blue | |
| z | 17.64 | ||
| znorm | Inf | ||
| sky | -Inf | -Inf | -Inf |
| S/N | 18.8 | 32.9 | 33.8 |
| S/N(c) | 0.0 | 0.0 | 0.0 |
| SN(E/C) |
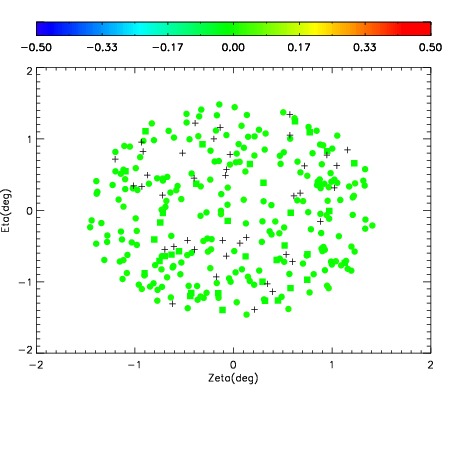

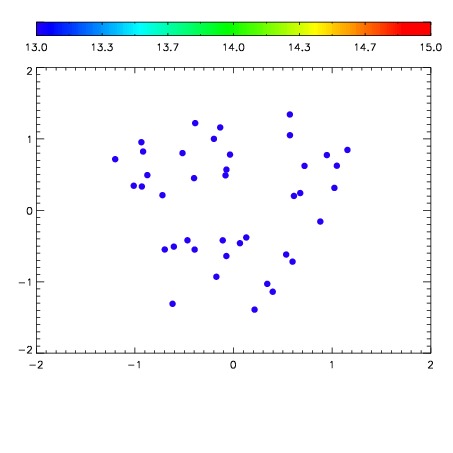

| Frame | Nreads | Zeropoints | Mag plots | Spatial mag deviation | Spatial sky 16325A emission deviations (filled: sky, open: star) | Spatial sky continuum emission | Spatial sky telluric CO2 absorption deviations (filled: H < 10) | |||||||||||||||||||||||
| 0 | 0 |
|
|
|
|
|
|
| IPAIR | NAME | SHIFT | NEWSHIFT | S/N | NAME | SHIFT | NEWSHIFT | S/N |
| 0 | 05210072 | 0.493974 | 0.00000 | 18.5600 | 05210073 | -0.00356355 | 0.497538 | 18.7066 |
| 1 | 05210076 | 0.490644 | 0.00332999 | 18.7195 | 05210077 | -0.00424219 | 0.498216 | 18.8181 |
| 2 | 05210075 | 0.490045 | 0.00392899 | 18.6425 | 05210074 | -0.00396432 | 0.497938 | 18.7850 |
| 3 | 05210071 | 0.492626 | 0.00134799 | 18.4211 | 05210070 | 0.00000 | 0.493974 | 18.3179 |