| Red | Green | Blue | |
| z | 17.64 | ||
| znorm | Inf | ||
| sky | -Inf | -Inf | -Inf |
| S/N | 23.1 | 39.4 | 40.6 |
| S/N(c) | 0.0 | 0.0 | 0.0 |
| SN(E/C) |


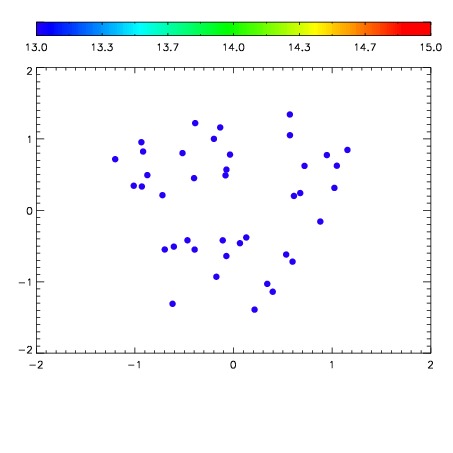

| Frame | Nreads | Zeropoints | Mag plots | Spatial mag deviation | Spatial sky 16325A emission deviations (filled: sky, open: star) | Spatial sky continuum emission | Spatial sky telluric CO2 absorption deviations (filled: H < 10) | |||||||||||||||||||||||
| 0 | 0 |
|
|
|
|
|
|
| IPAIR | NAME | SHIFT | NEWSHIFT | S/N | NAME | SHIFT | NEWSHIFT | S/N |
| 0 | 06060016 | 0.485586 | 0.00000 | 18.7429 | 06060013 | 0.000488813 | 0.485097 | 18.8600 |
| 1 | 06060011 | 0.482421 | 0.00316498 | 18.9605 | 06060010 | 0.00000 | 0.485586 | 19.0025 |
| 2 | 06060015 | 0.485017 | 0.000568986 | 18.9594 | 06060014 | 0.000986211 | 0.484600 | 18.9360 |
| 3 | 06060012 | 0.483145 | 0.00244099 | 18.8356 | 06060017 | 0.00433188 | 0.481254 | 18.9129 |