| Red | Green | Blue | |
| z | 17.64 | ||
| znorm | Inf | ||
| sky | -Inf | -Inf | -Inf |
| S/N | 21.0 | 37.9 | 38.1 |
| S/N(c) | 0.0 | 0.0 | 0.0 |
| SN(E/C) |
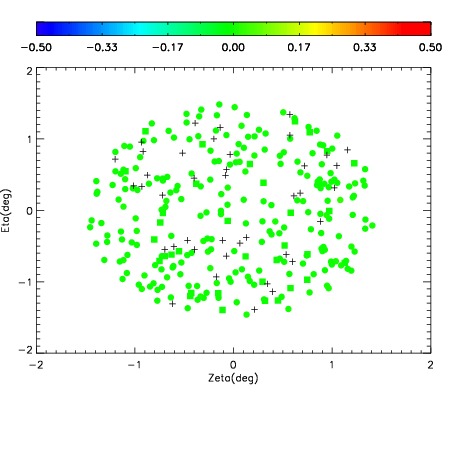
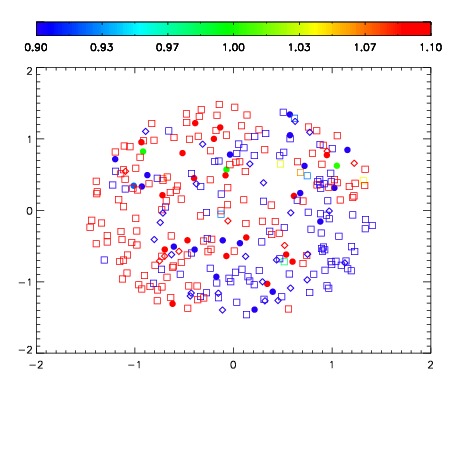


| Frame | Nreads | Zeropoints | Mag plots | Spatial mag deviation | Spatial sky 16325A emission deviations (filled: sky, open: star) | Spatial sky continuum emission | Spatial sky telluric CO2 absorption deviations (filled: H < 10) | |||||||||||||||||||||||
| 0 | 0 |
|
|
|
|
|
|
| IPAIR | NAME | SHIFT | NEWSHIFT | S/N | NAME | SHIFT | NEWSHIFT | S/N |
| 0 | 06080027 | 0.481985 | 0.00000 | 18.8749 | 06080029 | 0.000551957 | 0.481433 | 18.8626 |
| 1 | 06080031 | 0.480438 | 0.00154701 | 18.9274 | 06080032 | 0.000609739 | 0.481375 | 18.9430 |
| 2 | 06080030 | 0.480010 | 0.00197500 | 18.8938 | 06080028 | 0.000668312 | 0.481317 | 18.8682 |
| 3 | 06080026 | 0.481175 | 0.000809997 | 18.7726 | 06080025 | 0.00000 | 0.481985 | 18.7555 |